| # | Name | Other | Coord (J2000) | Type | Max | Min | System | Period | Epoch (JD) | type | Sp | Comment | L.Curve | Find.Chart | Data |
|---|---|---|---|---|---|---|---|---|---|---|---|---|---|---|---|
| 1 | Karachurin 12 | 2MASS J17271078+6145278, USNO-B1.0 1517-0246427, FBS 1726+618 | 17 27 10.80 +61 45 27.8 | UGZ | 13.8 13.54 | 14.9 16.19 | V/g | B2 | Type from vsnet-chat 7938. Range from ASAS-SN data. Light curve from CSS and ZTF data. | karachurin12-css-ztf-lc.png karachurin12-lc.png | karachurin12.jpg | karachurin12-css-hjd.dat karachurin12-ztf-g.dat karachurin12-ztf-r.dat karachurin12-asassn.csv ZTF18aakvuwy | |||
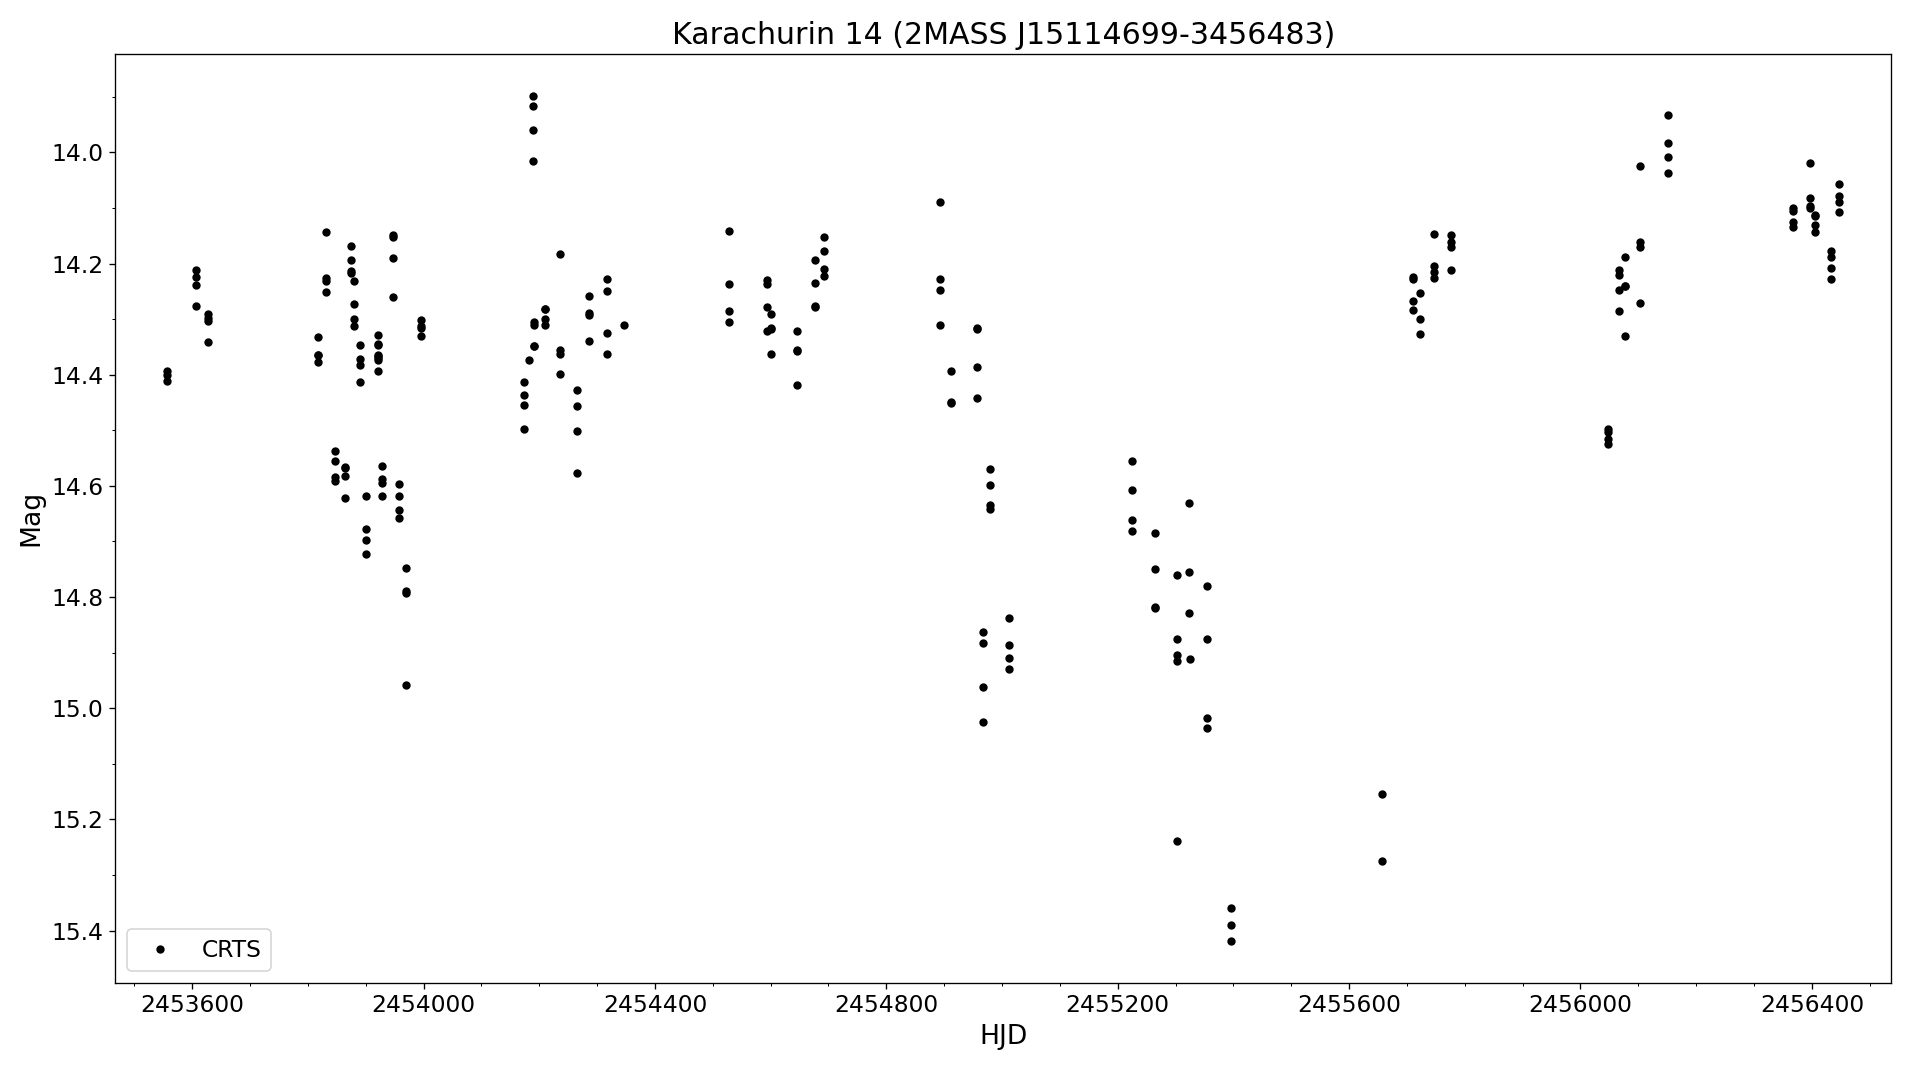
| 2 | Karachurin 14 | 2MASS J15114699-3456483, GSC2.3 S9H6047915, USNO-B1.0 0550-0344965 | 15 11 46.99 -34 56 48.4 | NL/VY: | 13.9 CV | 17.4 V | CV/V | Minimum magnitude from GSPC V2.4. Light curve from SSS data. | karachurin14-sss-lc.png karachurin14-lc.png | karachurin14.png | karachurin14-sss-hjd.dat | ||||
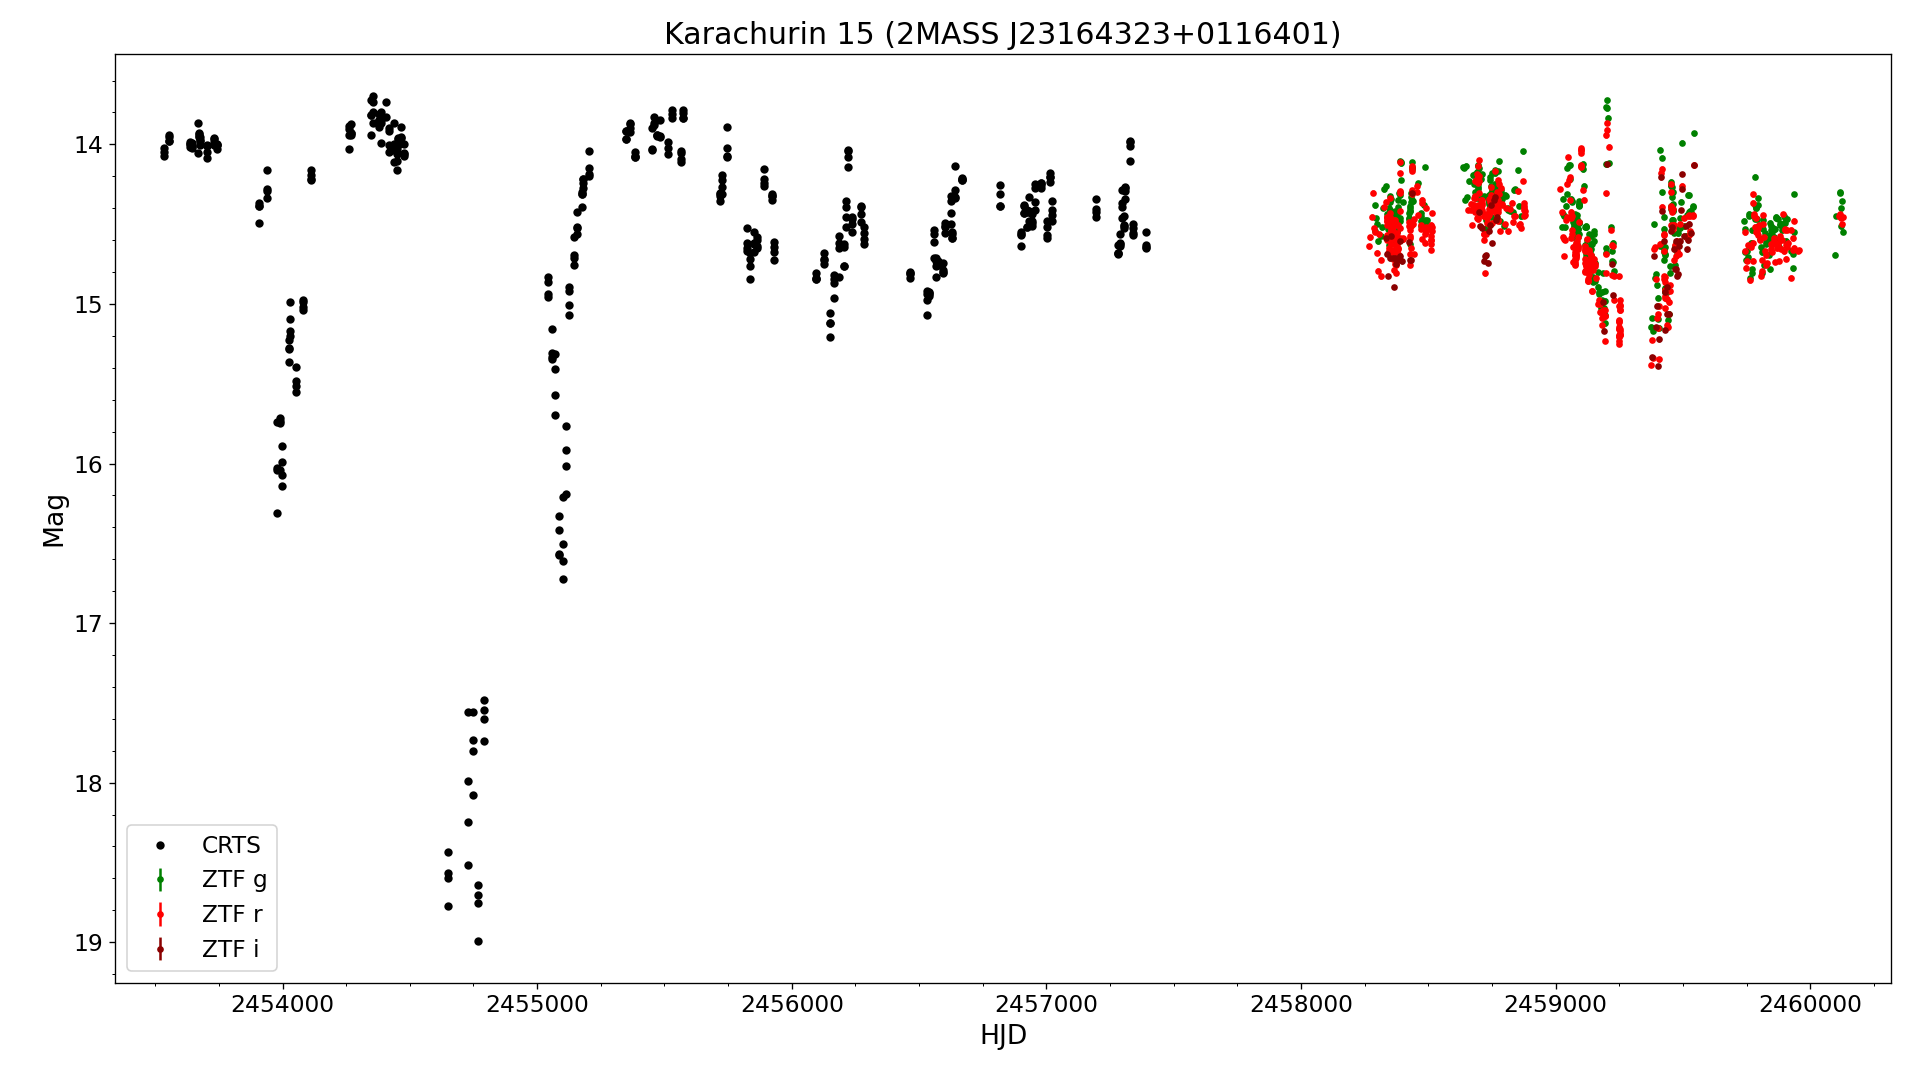
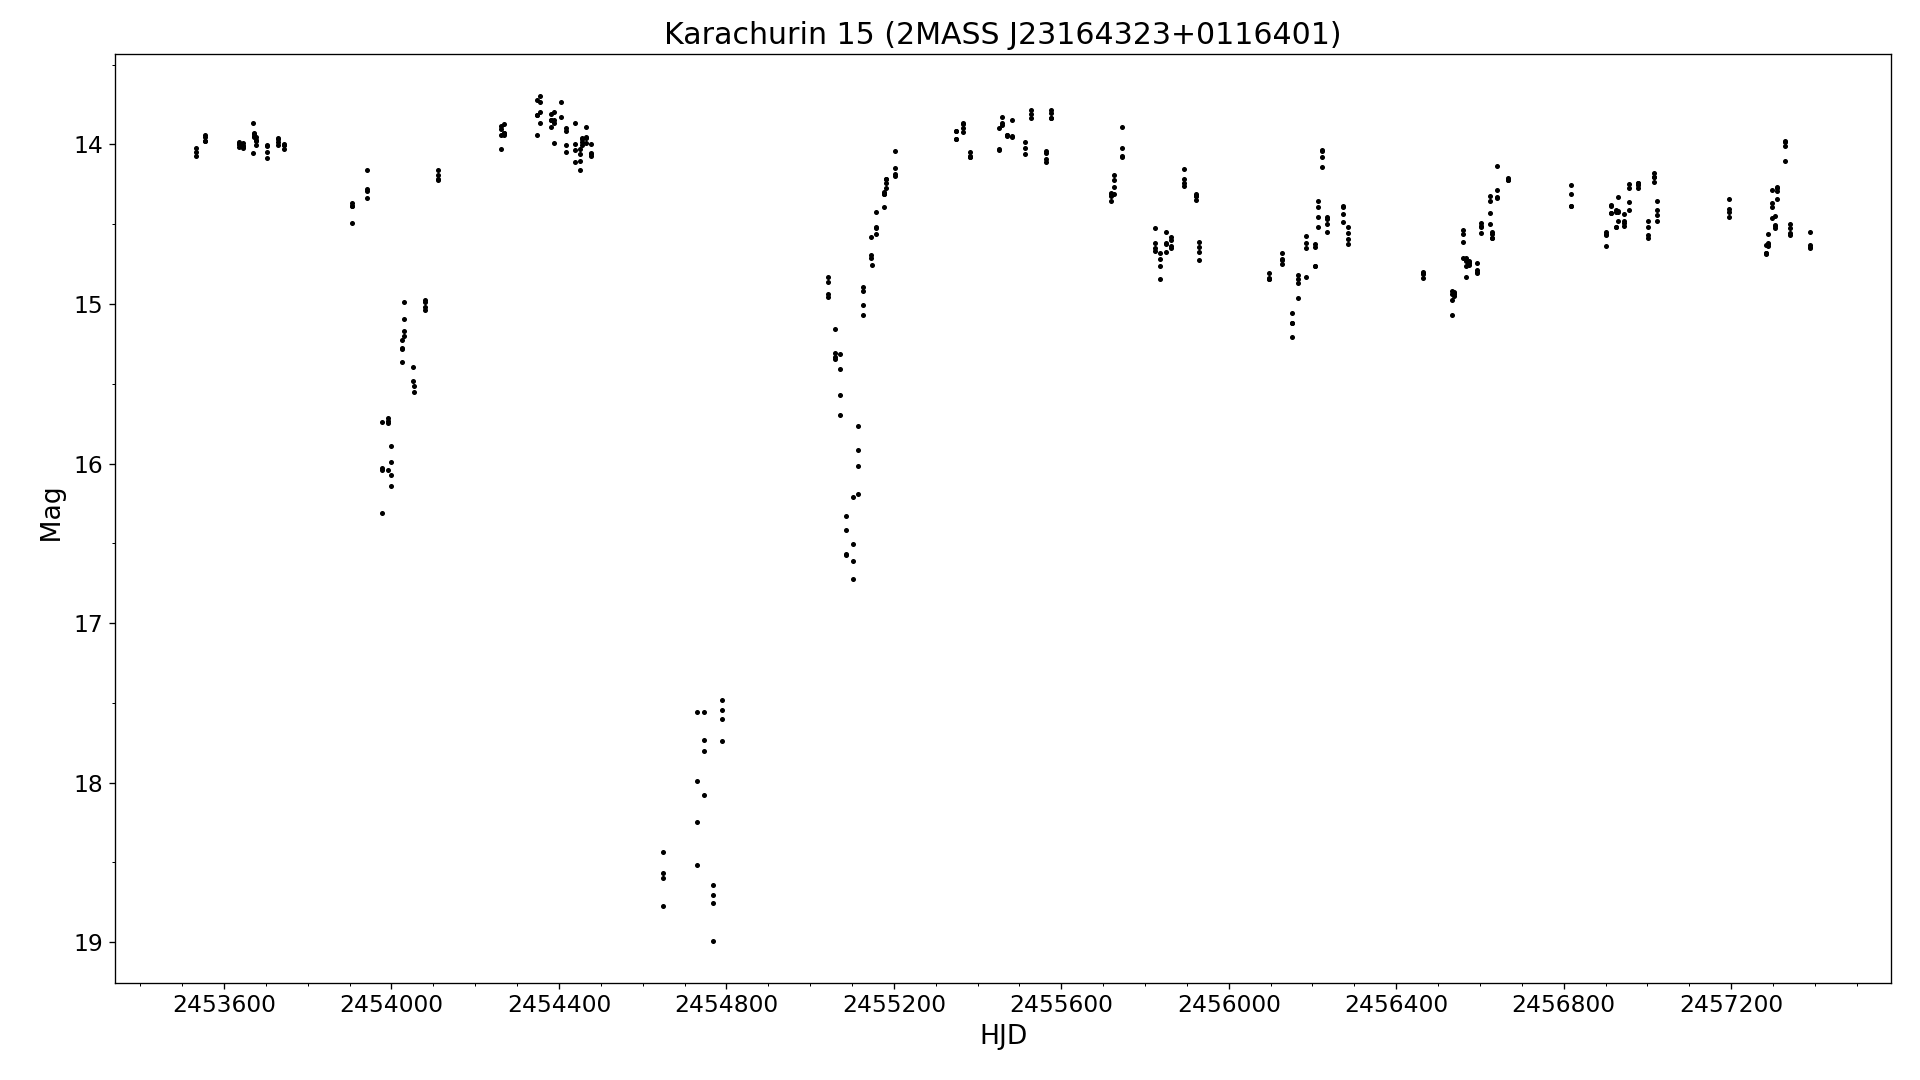
| 3 | Karachurin 15 | 2MASS J23164323+0116401, USNO-B1.0 0912-0566706 | 23 16 43.23 +01 16 40.2 | UGZ/IW+VY | 13.4? 13.72 g 13.7 CV | 18.99 CV | g/CV | Type and maximum magnitude from ZTF data. Light curve from CSS and ZTF data. | karachurin15-css-ztf-lc.png karachurin15-css-lc.png karachurin15-lc.png | karachurin15.jpg | karachurin15-css-hjd.dat karachurin15-ztf-g.dat karachurin15-ztf-r.dat karachurin15-ztf-i.dat ZTF18abtxxag, ZTF18abzyqas | ||||
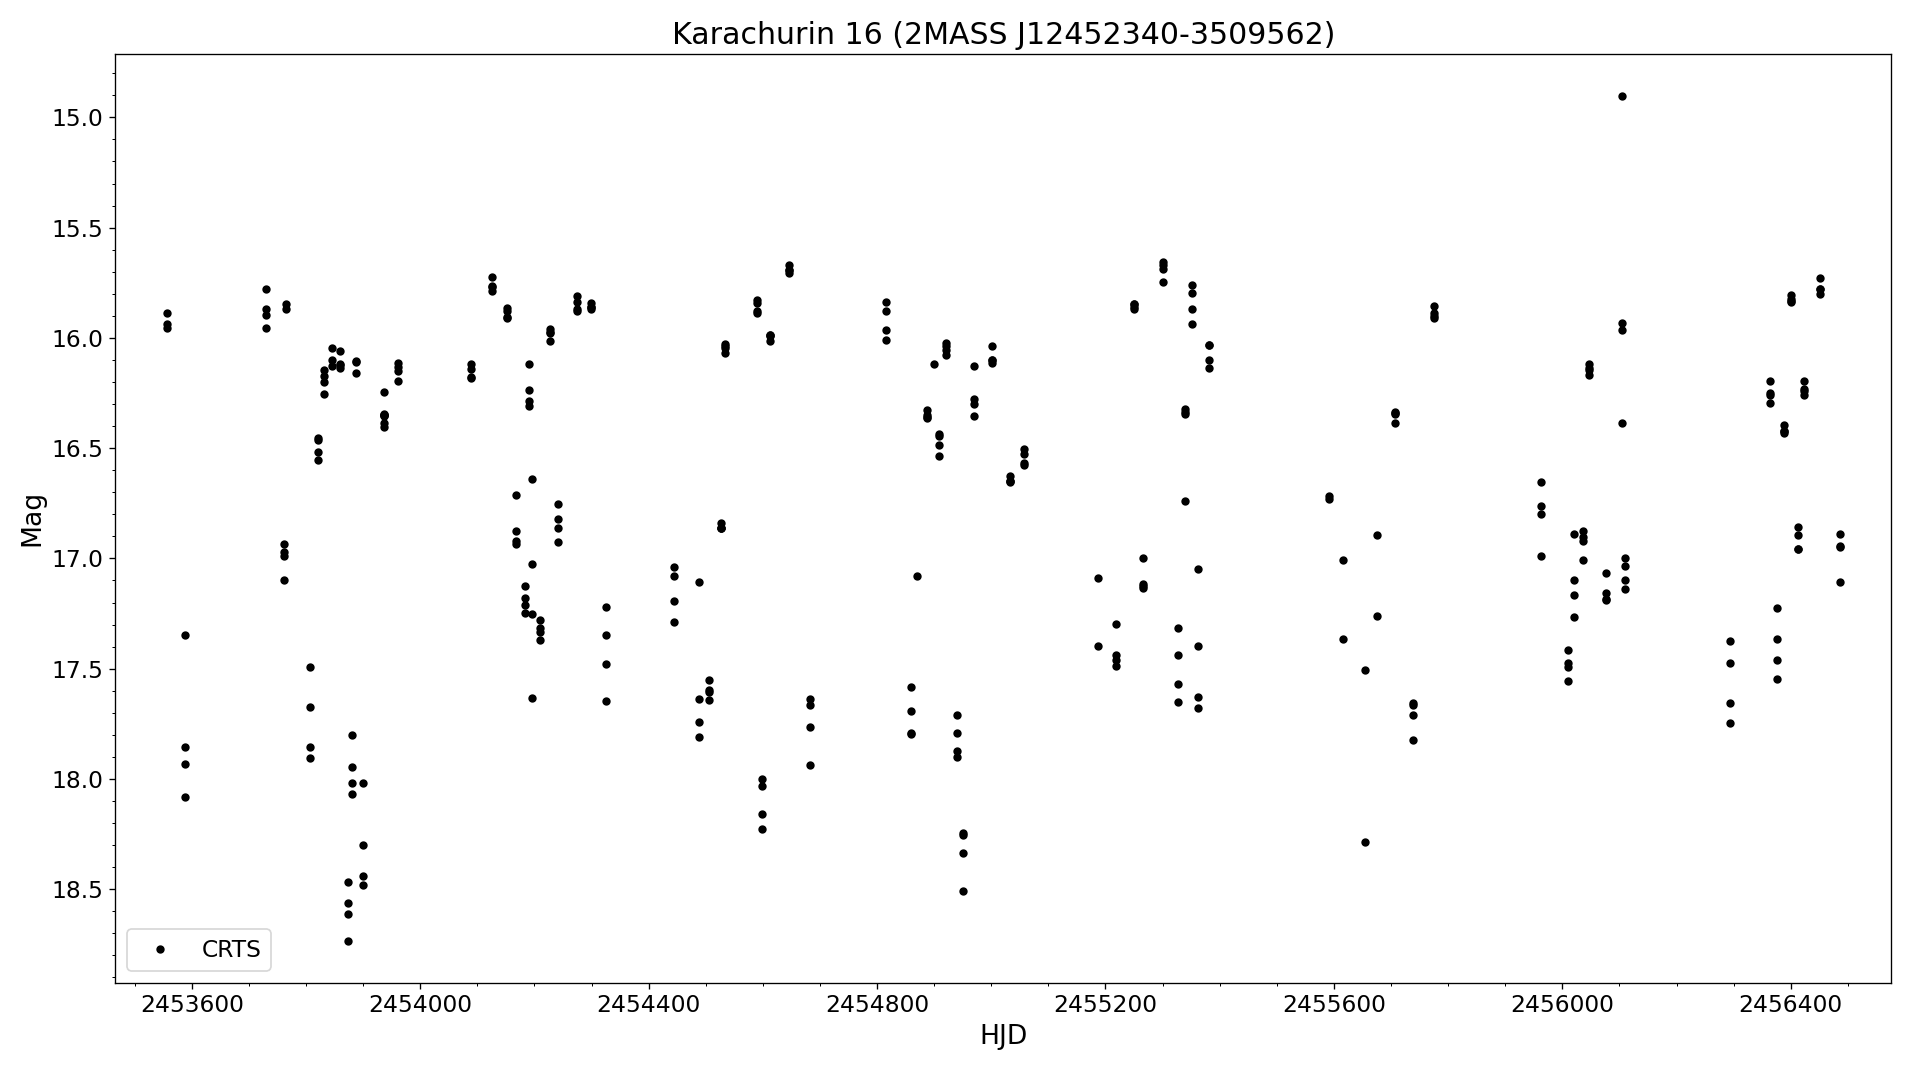
| 4 | Karachurin 16 | 2MASS J12452340-3509562, GSC2.3 S6J5013792, USNO-B1.0 0548-0278718 | 12 45 23.43 -35 09 56.4 | UG | 15.6 | 18.73 CV | CV | Light curve from SSS data. | karachurin16-sss-lc.png karachurin16-lc.png | karachurin16.png | karachurin16-sss-hjd.dat | ||||
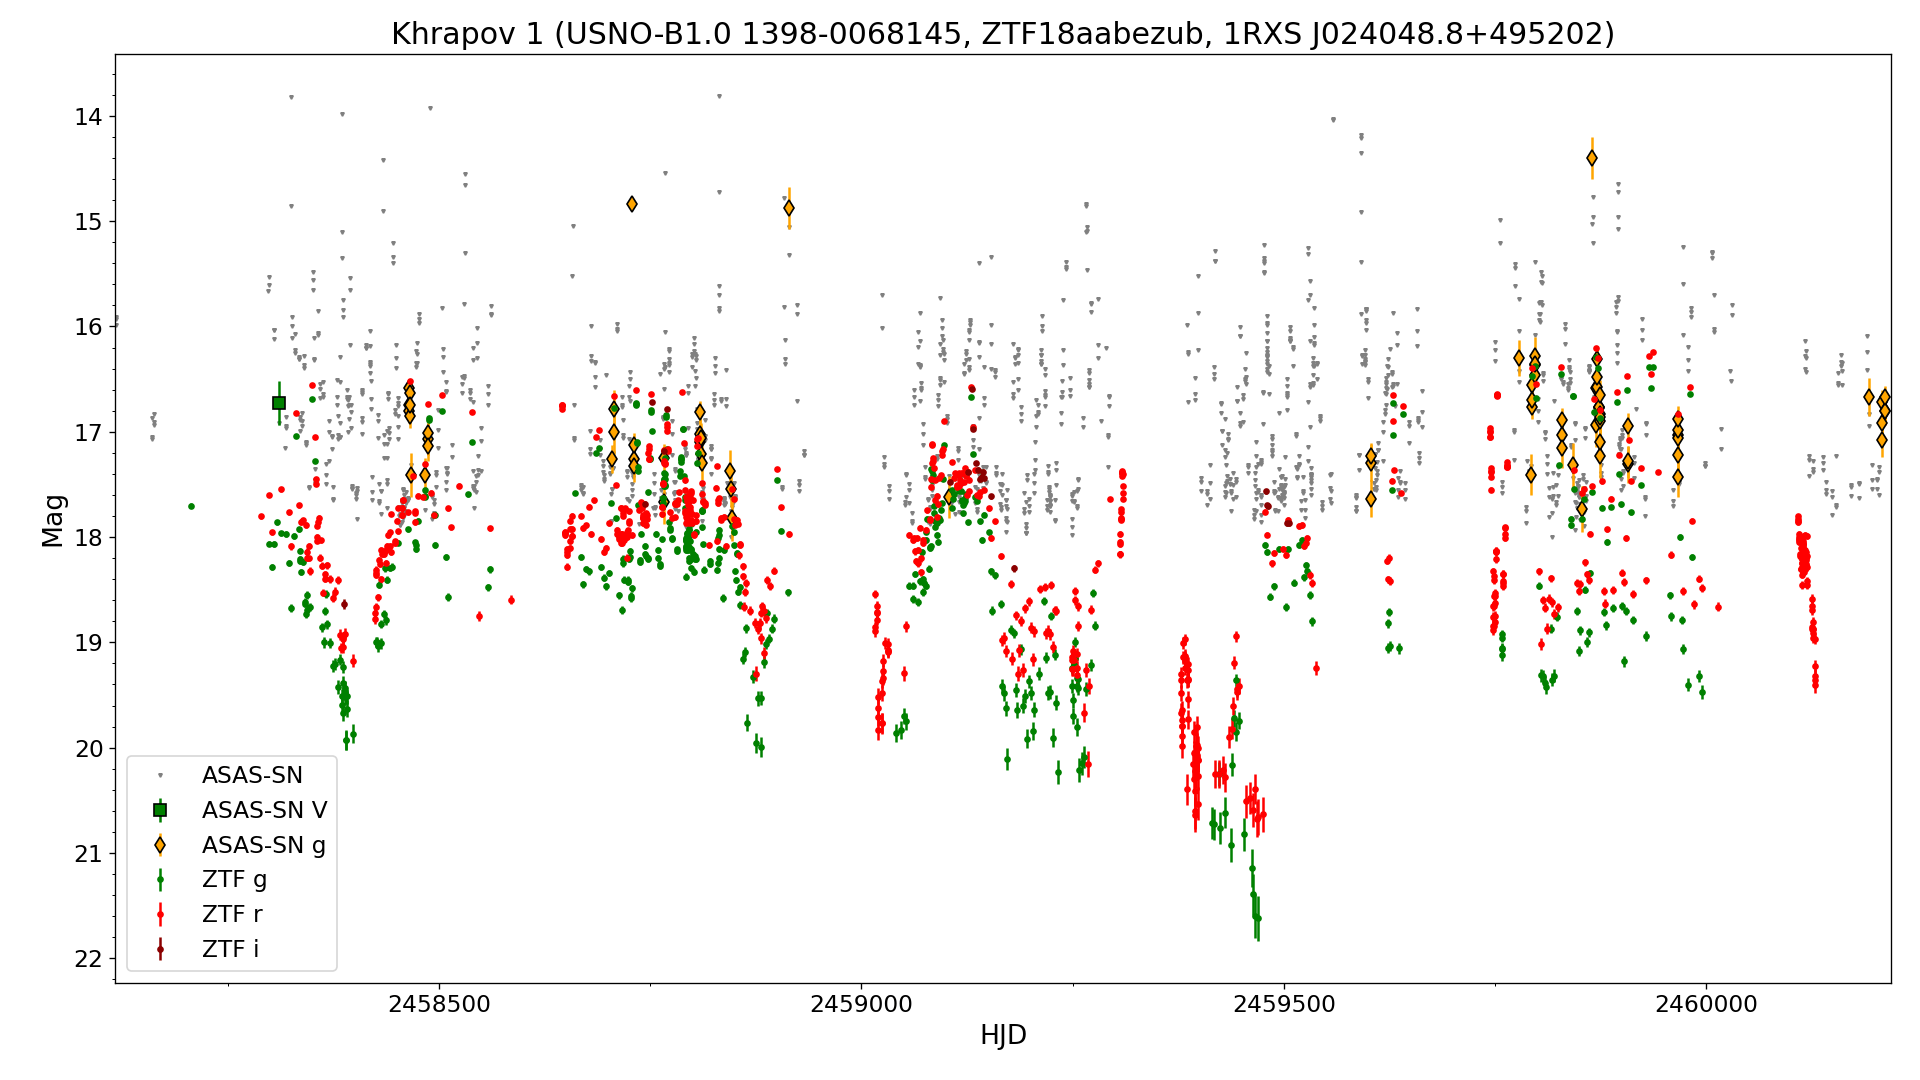
| 5 | Khrapov 1 | USNO-B1.0 1398-0068145, ZTF18aabezub, 1RXS J024048.8+495202 | 02 40 49.85 +49 51 54.9 | UG+VY: | 16.2 | 20.7 r | r | Gaia DR2 derived MV=+7.3. Maximum magnitude from APASS data. Minimum magnitude derived from Gaia DR2. Type and range from ZTF data. Light curve from ASAS-SN and ZTF data | khrapov1-ztf-asas-lc.png khrapov1-asassn-lc.png | khrapov1-brir.jpg | khrapov1-ztf-g.dat khrapov1-ztf-r.dat khrapov1-ztf-i.dat khrapov1-asassn-lc.dat ZTF18aabezub | ||||
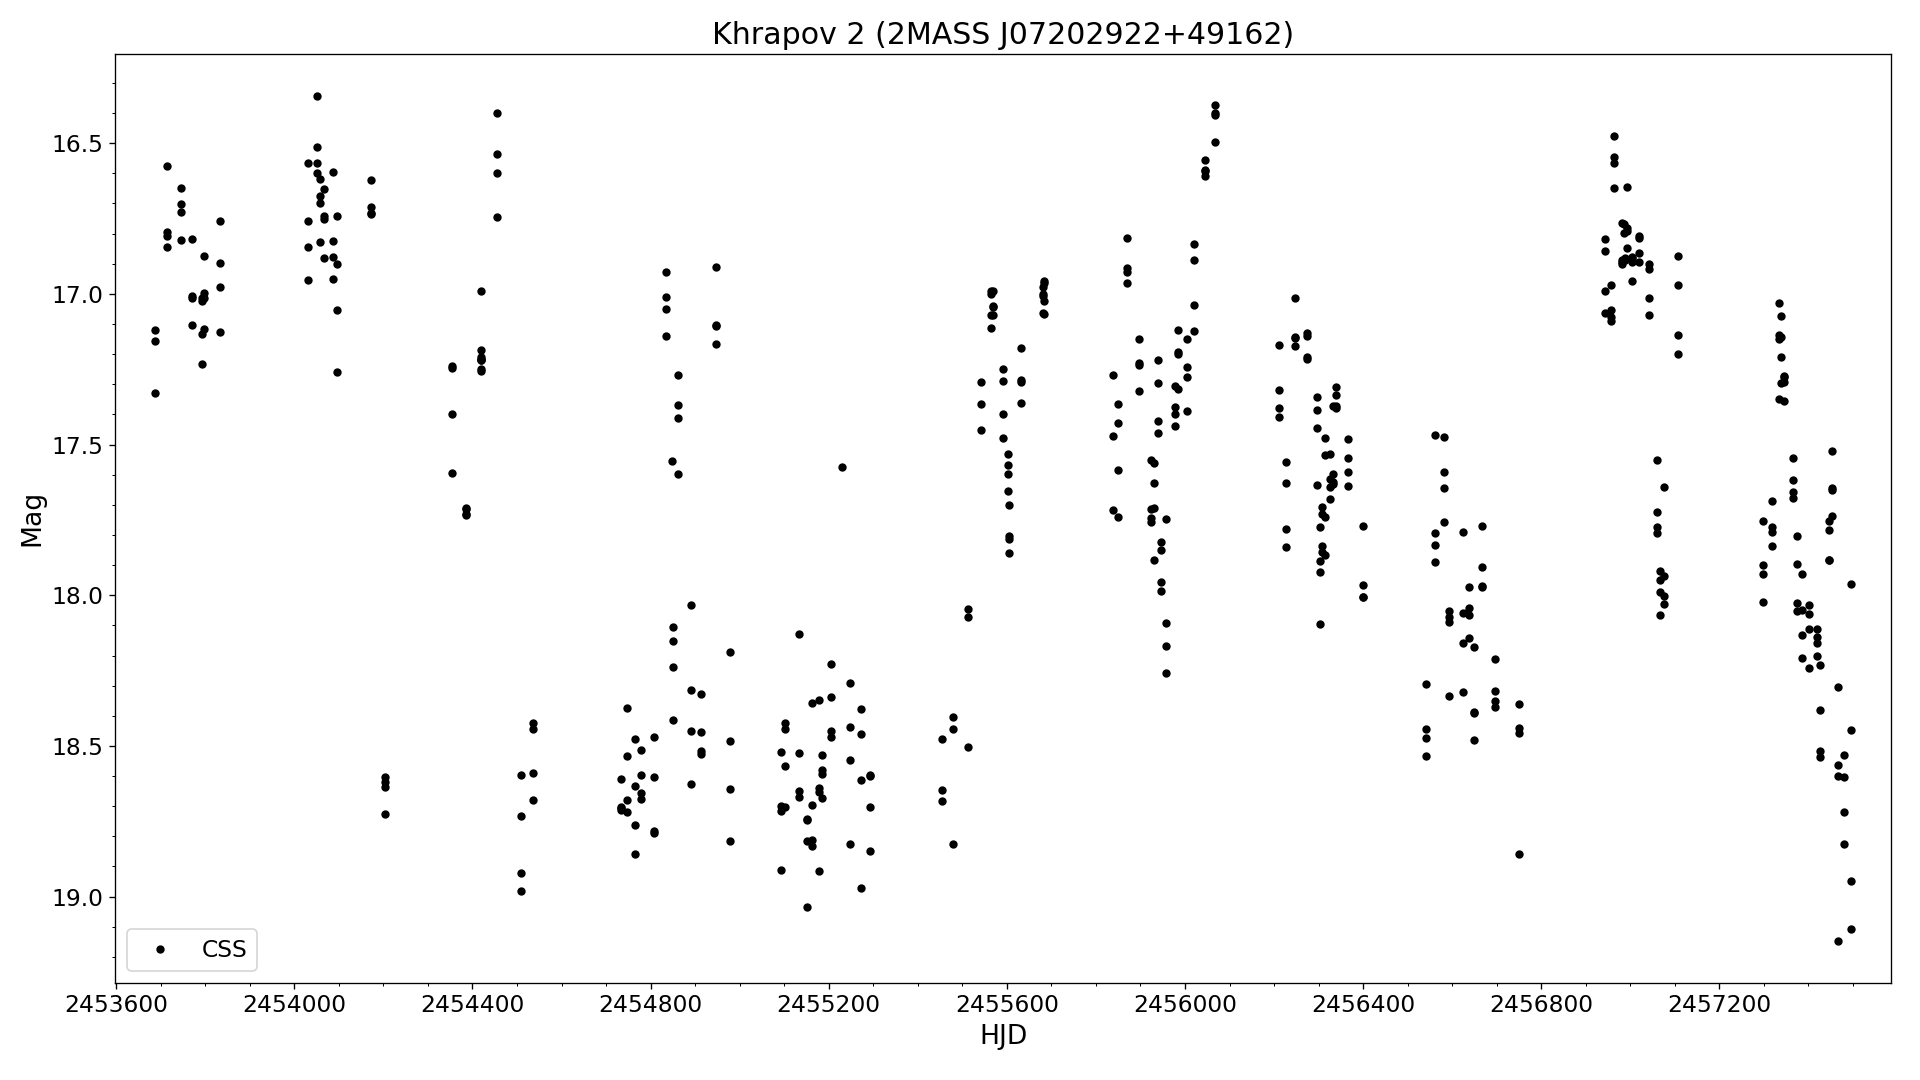
| 6 | Khrapov 2 | 2MASS J07202922+4916255, USNO-B1.0 1392-0185246 | 07 20 29.21 +49 16 25.7 | AM: | 16.3 | 19.0 CV | CV | Gaia parallax = 2.05+/-0.15 mas (distance = 487+/-36 pc). Light curve from CSS data. | khrapov2-css-lc.png khrapov2-crts-lc.png | khrapov2-brir.jpg | khrapov2-css-hjd.dat | ||||
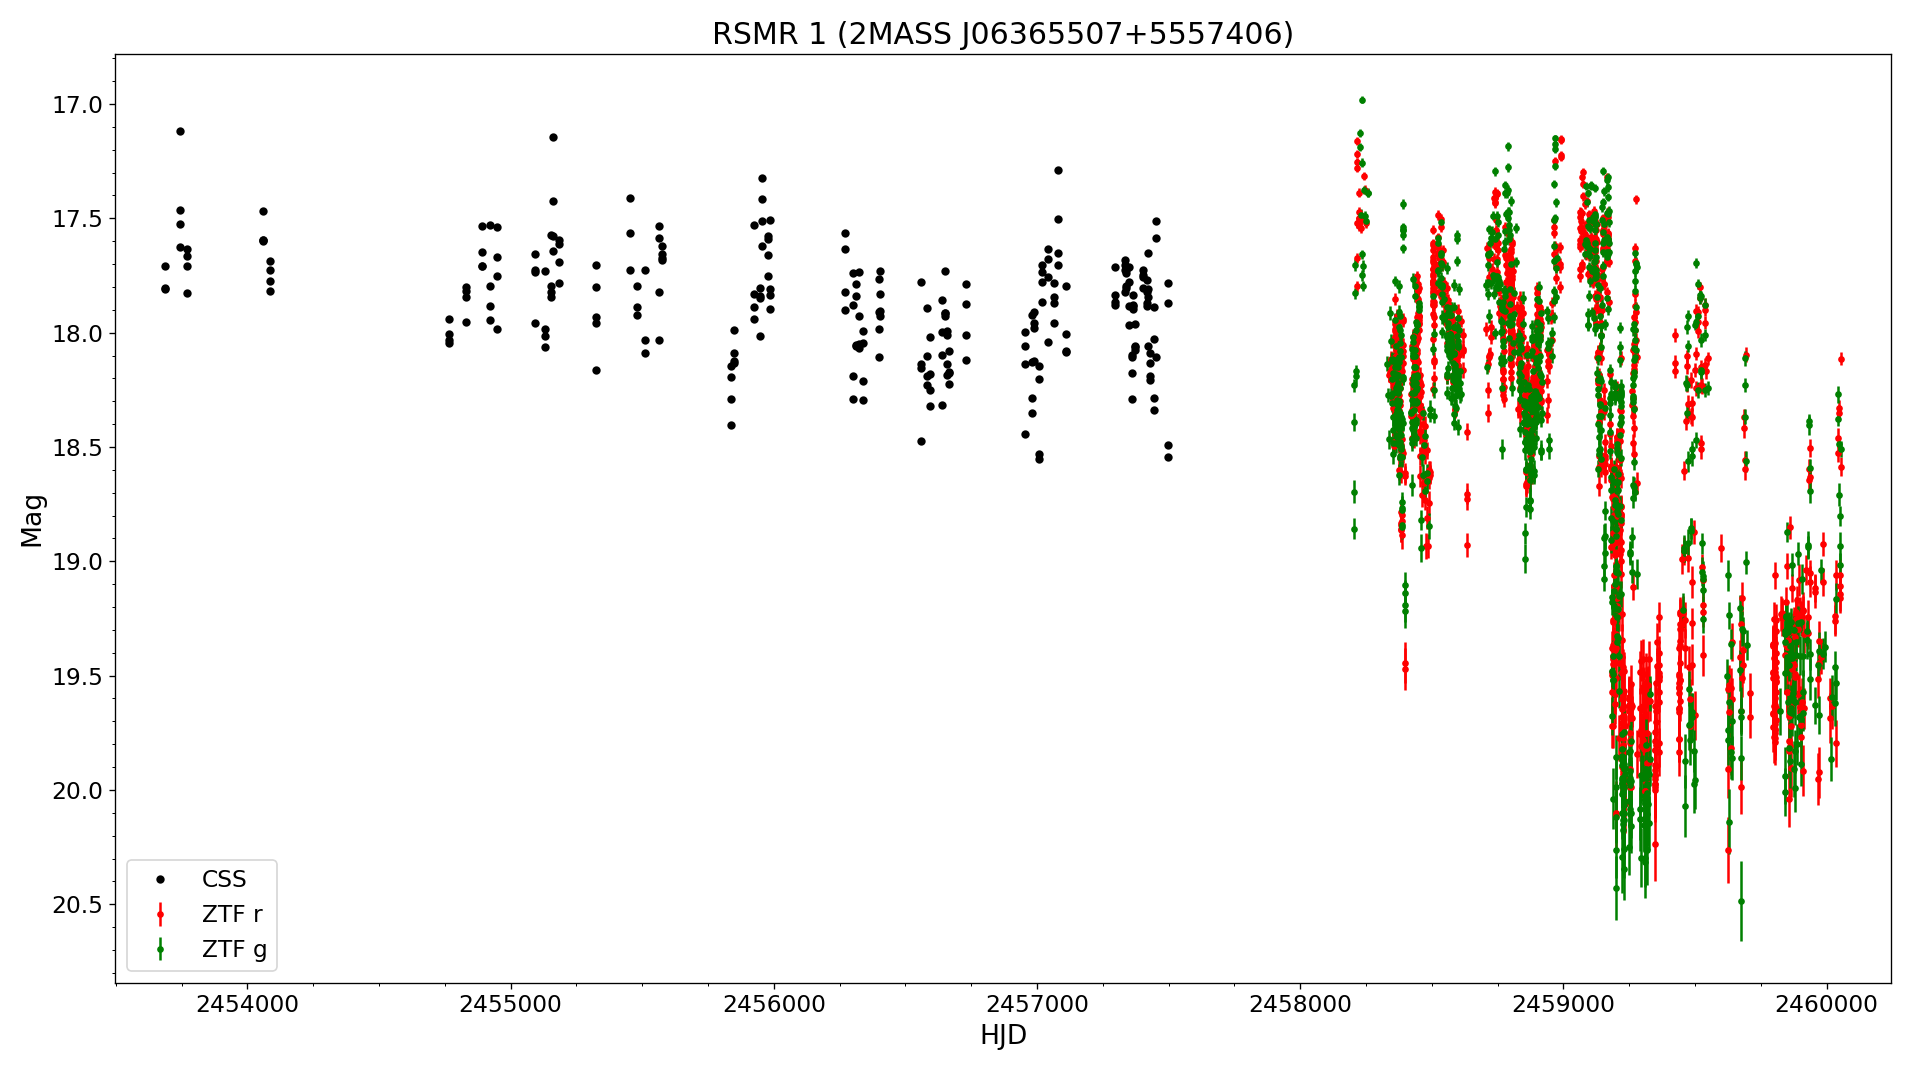
| 7 | RSMR 1 | 2MASS J06365507+5557406, USNO-B1.0 1459-0176536 | 06 36 55.05 +55 57 40.7 | NL/VY | 17.1 | 21.0 g | g | Gaia parallax = 2.51+/-0.25 mas (distance = 398+/-40 pc). Type and range from ZTF data. Light curve from CSS and ZTF data. | rsmr1-css-ztf-lc.png rsmr1-crts-lc.png | rsmr1-brir.jpg | rsmr1-css-hjd.dat rsmr1-ztf-g.dat rsmr1-ztf-r.dat ZTF18aabhjpn | ||||
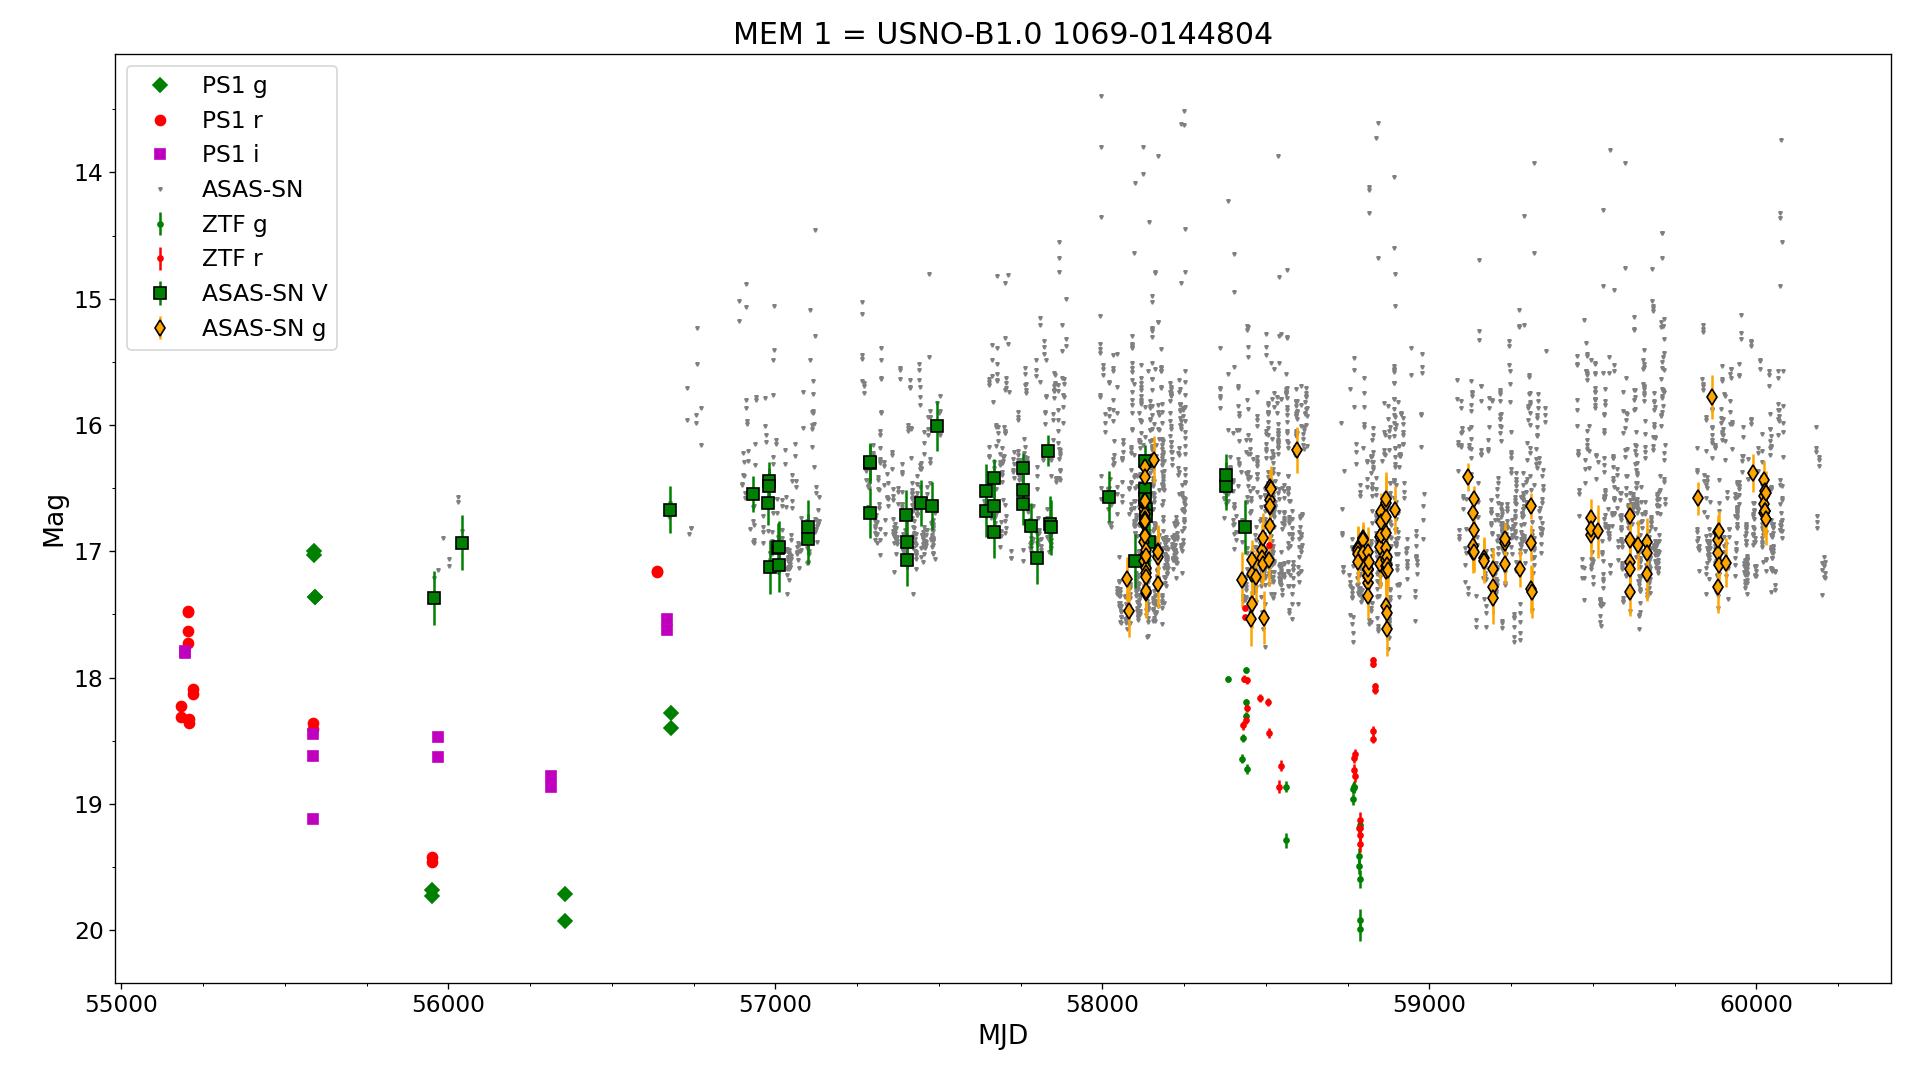
| 8 | MEM 1 | USNO-B1.0 1069-0144804 | 07 16 17.95 +16 59 35.2 | CV | 16.4 | 19.6 V | V | Maximum magnitude from ASAS-SN data, minimum magnitude derived from USNO-B1.0. Animation of POSS-II Blue plates on 1996-11-13 and 1997-02-03. Light curve from ASAS-SN data | mem1-ps1-ztf-asas-lc.png mem1-asassn-lc-vsx.png | mem1-brir.jpg mem1-dss-blue-anim.gif | mem1-ztf-g.dat mem1-ztf-r.dat mem1-asassn-lc.csv | ||||
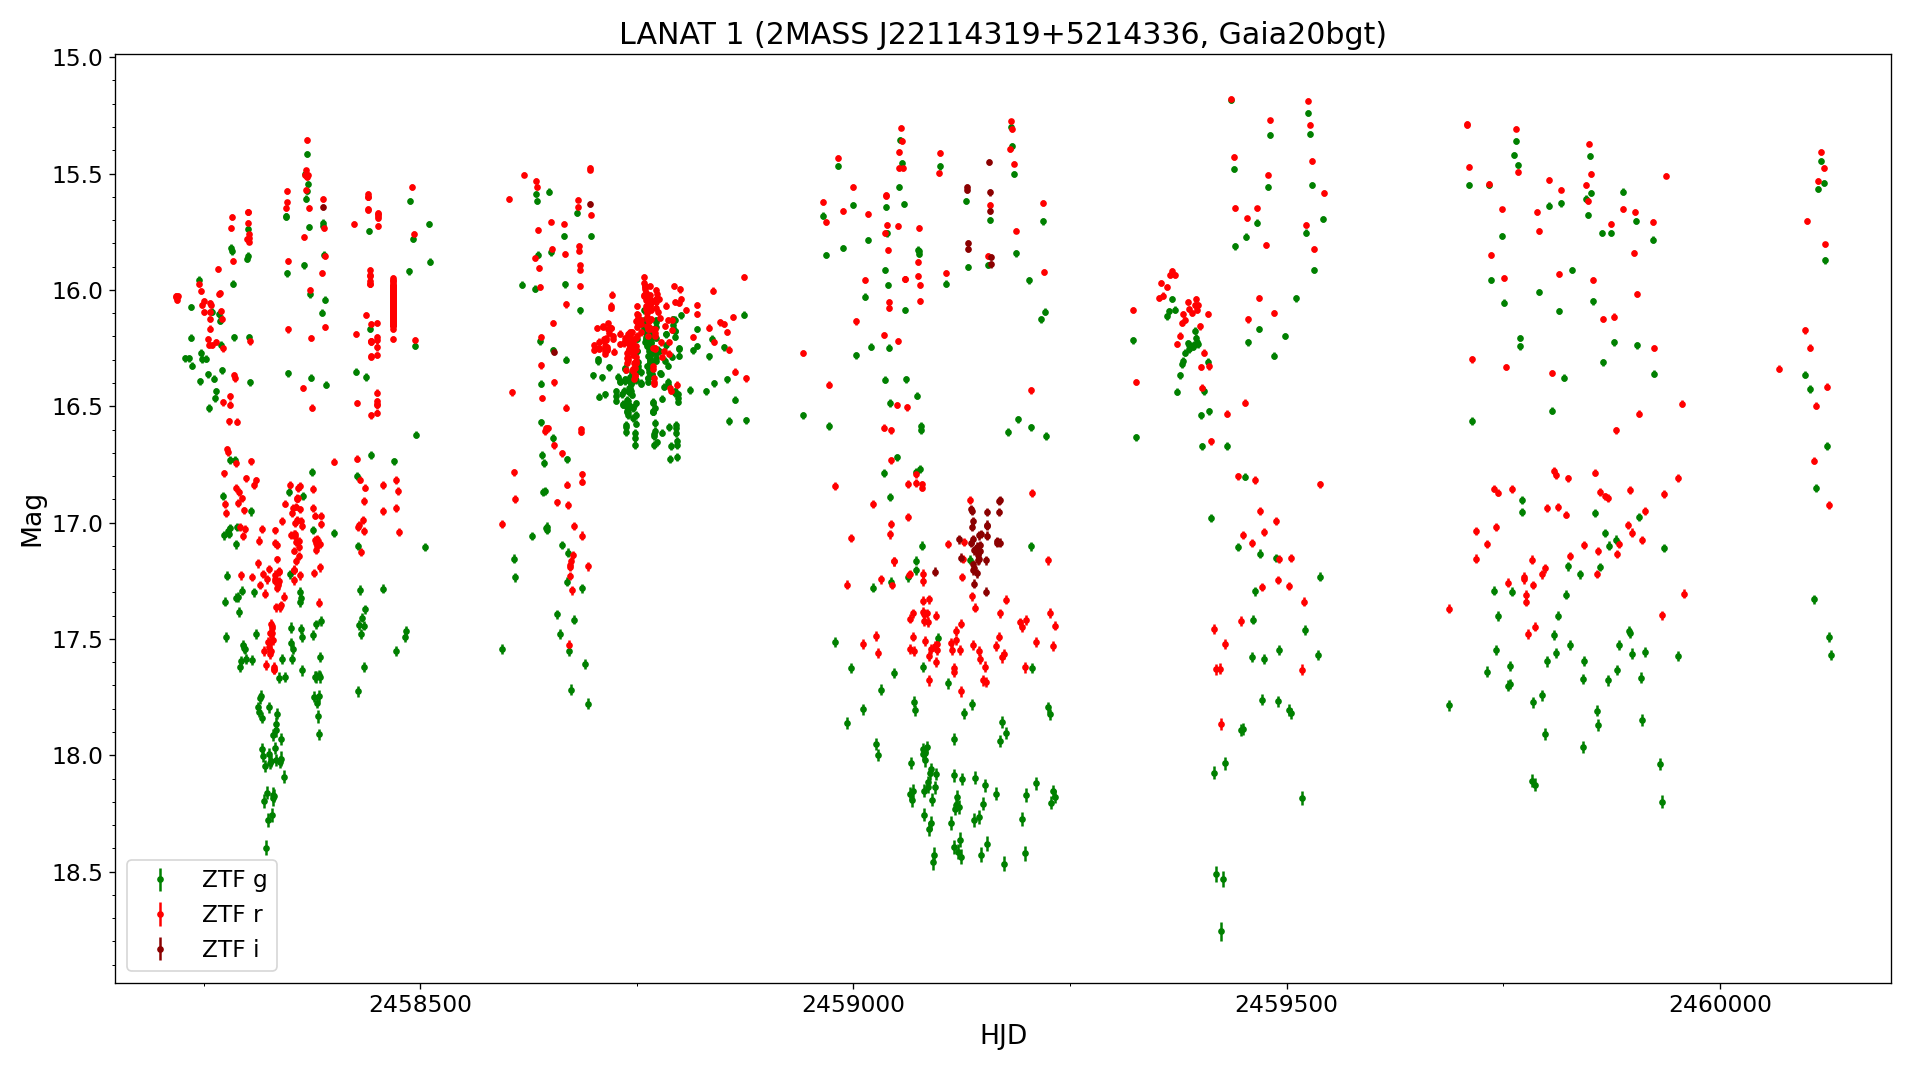
| 9 | LANAT 1 | 2MASS J22114319+5214336, USNO-B1.0 1422-0490414, Gaia20bgt | 22 11 43.20 +52 14 33.7 | UGZ: | 15.5 | 18.4 g | g | em | Discovered during Moscow State University's LANAT summer camp. Standstill in ZTF data during MJD= 58217-58270. Light curve from ZTF data. | lanat1-ztf-lc.png lanat1-ztf-lc-vsx.png | lanat1-brir.jpg | lanat1-ztf-g.dat lanat1-ztf-r.dat ZTF17aaawrkt | |||
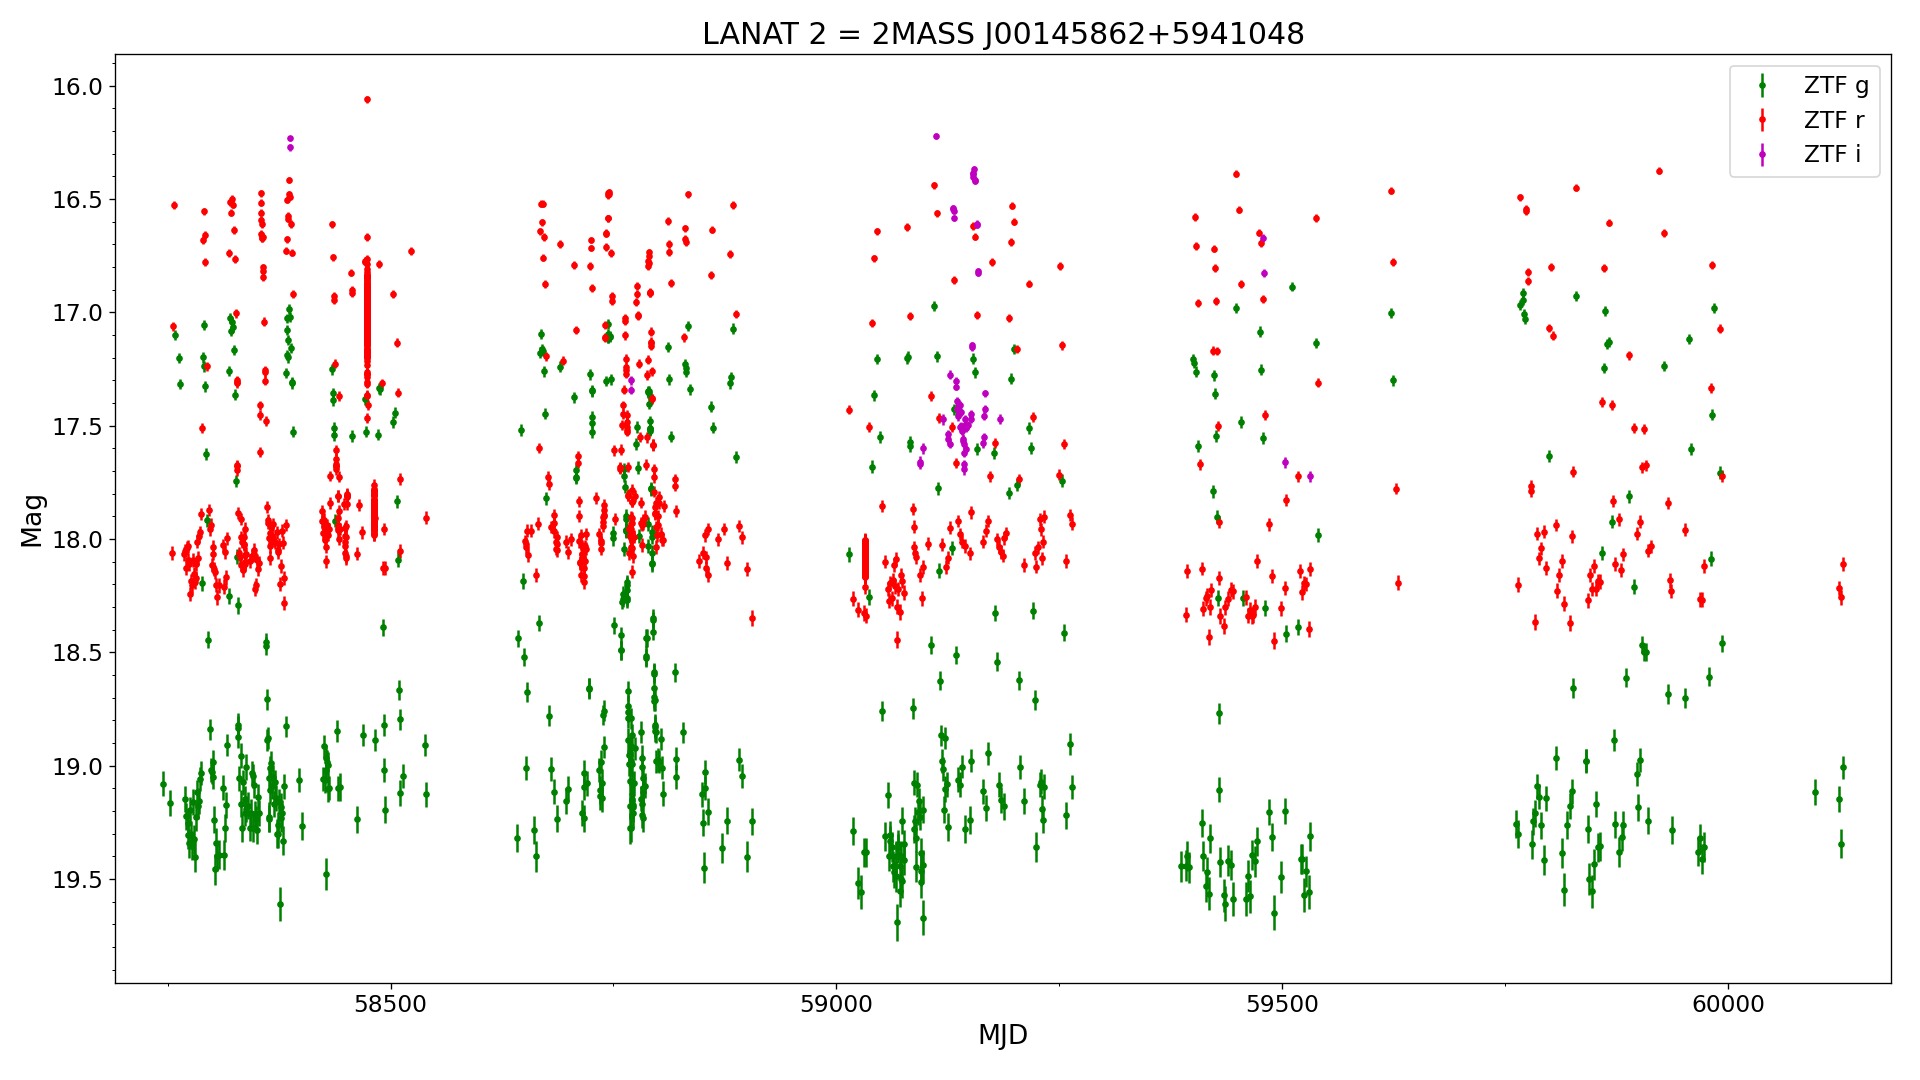
| 10 | LANAT 2 | 2MASS J00145862+5941048, USNO-B1.0 1496-0007834 | 00 14 58.62 +59 41 04.7 | UG | 17.0 | 19.4 g | g | em | Discovered during Moscow State University's LANAT summer camp. Light curve from ZTF data. | lanat2-ztf-lc.png lanat2-ztf-lc-vsx.png | lanat2-brir.jpg | lanat2-ztf-g.dat lanat2-ztf-r.dat ZTF17aaaedfi | |||
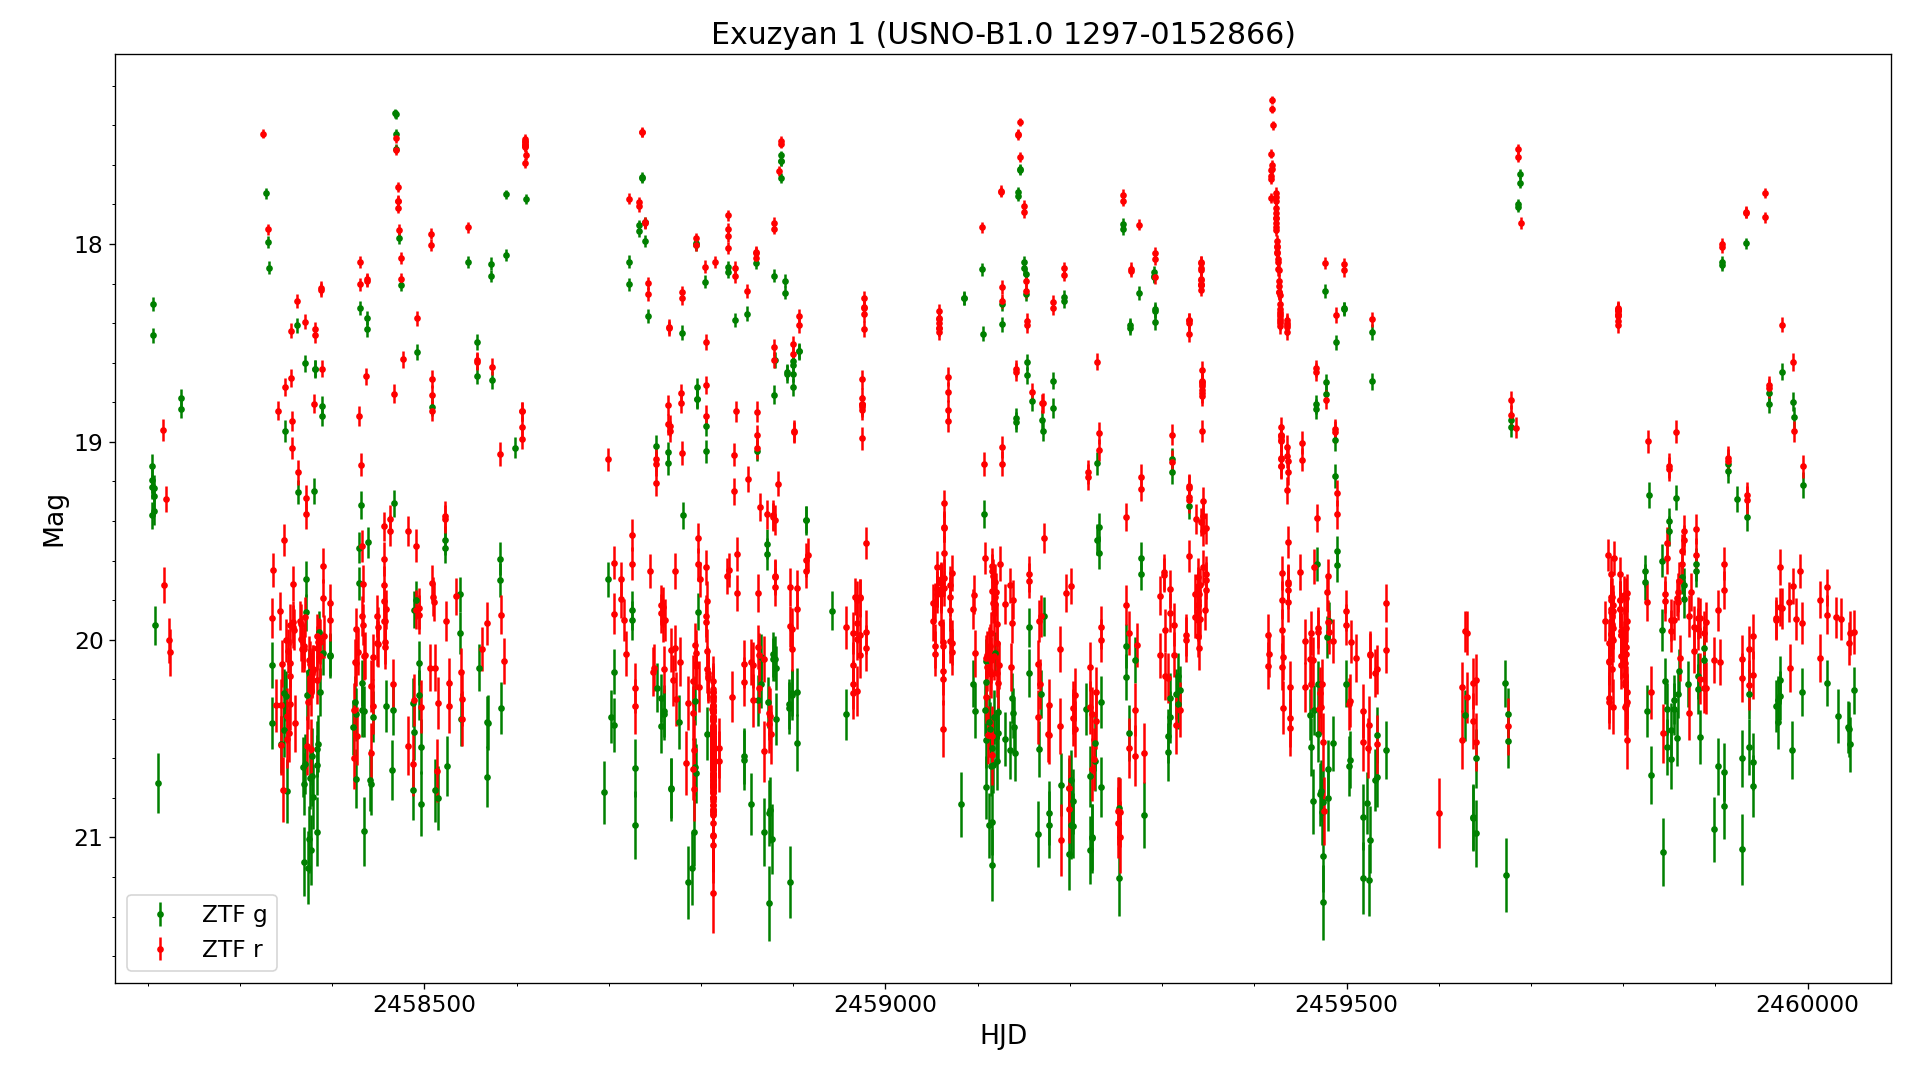
| 11 | Exuzyan 1 | USNO-B1.0 1297-0152866 | 05 38 50.21 +39 45 42.6 | UGSU | 17.3 | 20.8 g | g | em | Discovered during Moscow State University's LANAT summer camp. Light curve from ZTF data. | exuzyan1-ztf-lc.png exuzyan1-ztf-lc-vsx.png | exuzyan1-brir5x5.jpg | exuzyan1-ztf-g.dat exuzyan1-ztf-r.dat ZTF18aaaedcd | |||
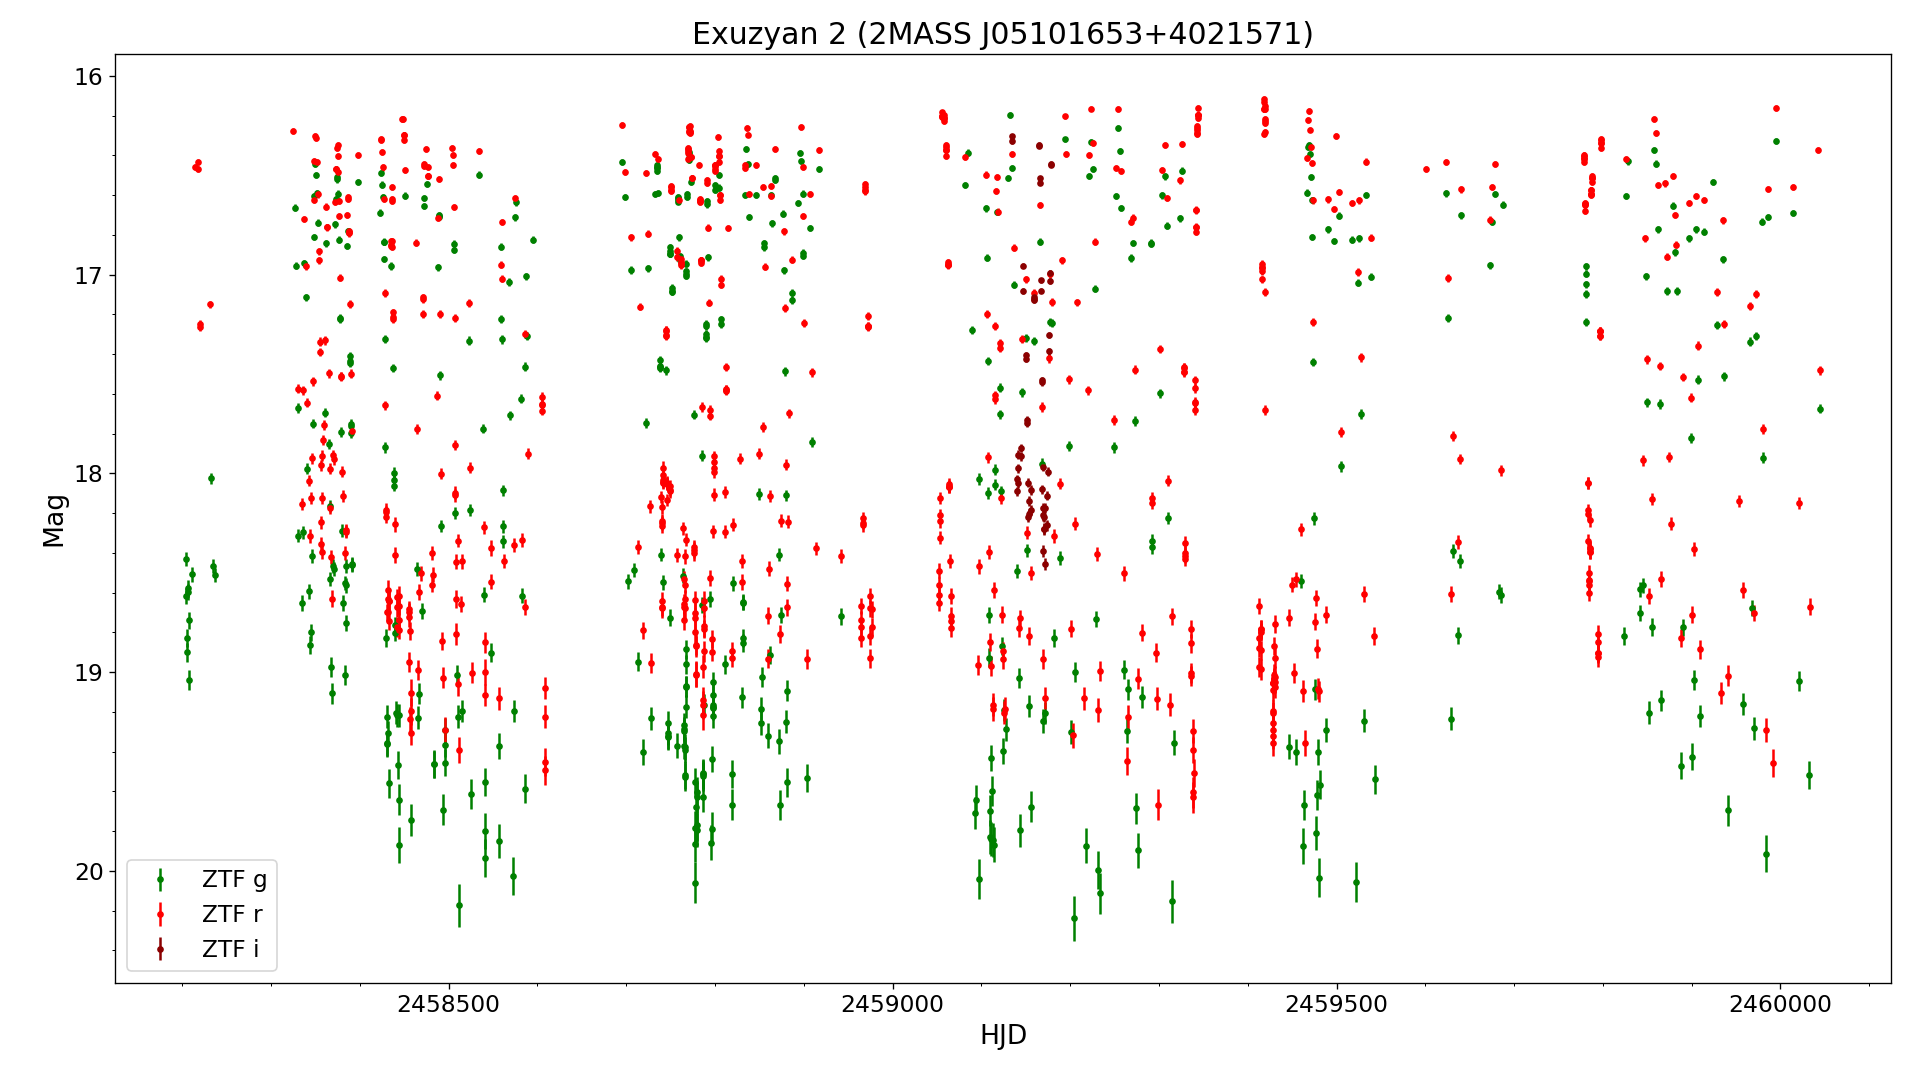
| 12 | Exuzyan 2 | 2MASS J05101653+4021571, GSC2.3 NCA4018258, GSC2.3 NCA4067993, USNO-B1.0 1303-0118219, ZTF17aabizrq, Gaia20bjf | 05 10 16.55 +40 21 57.1 | UG | 16.5 | 19.7 g | g | em | In outburst in GSC2.3 (Bjmag. 15.6). Discovered during Moscow State University's LANAT summer camp. Light curve from ZTF data. | exuzyan2-ztf-lc.png exuzyan2-ztf-lc-vsx.png | exuzyan2-brir.jpg | exuzyan2-ztf-g.dat exuzyan2-ztf-r.dat ZTF17aabizrq | |||
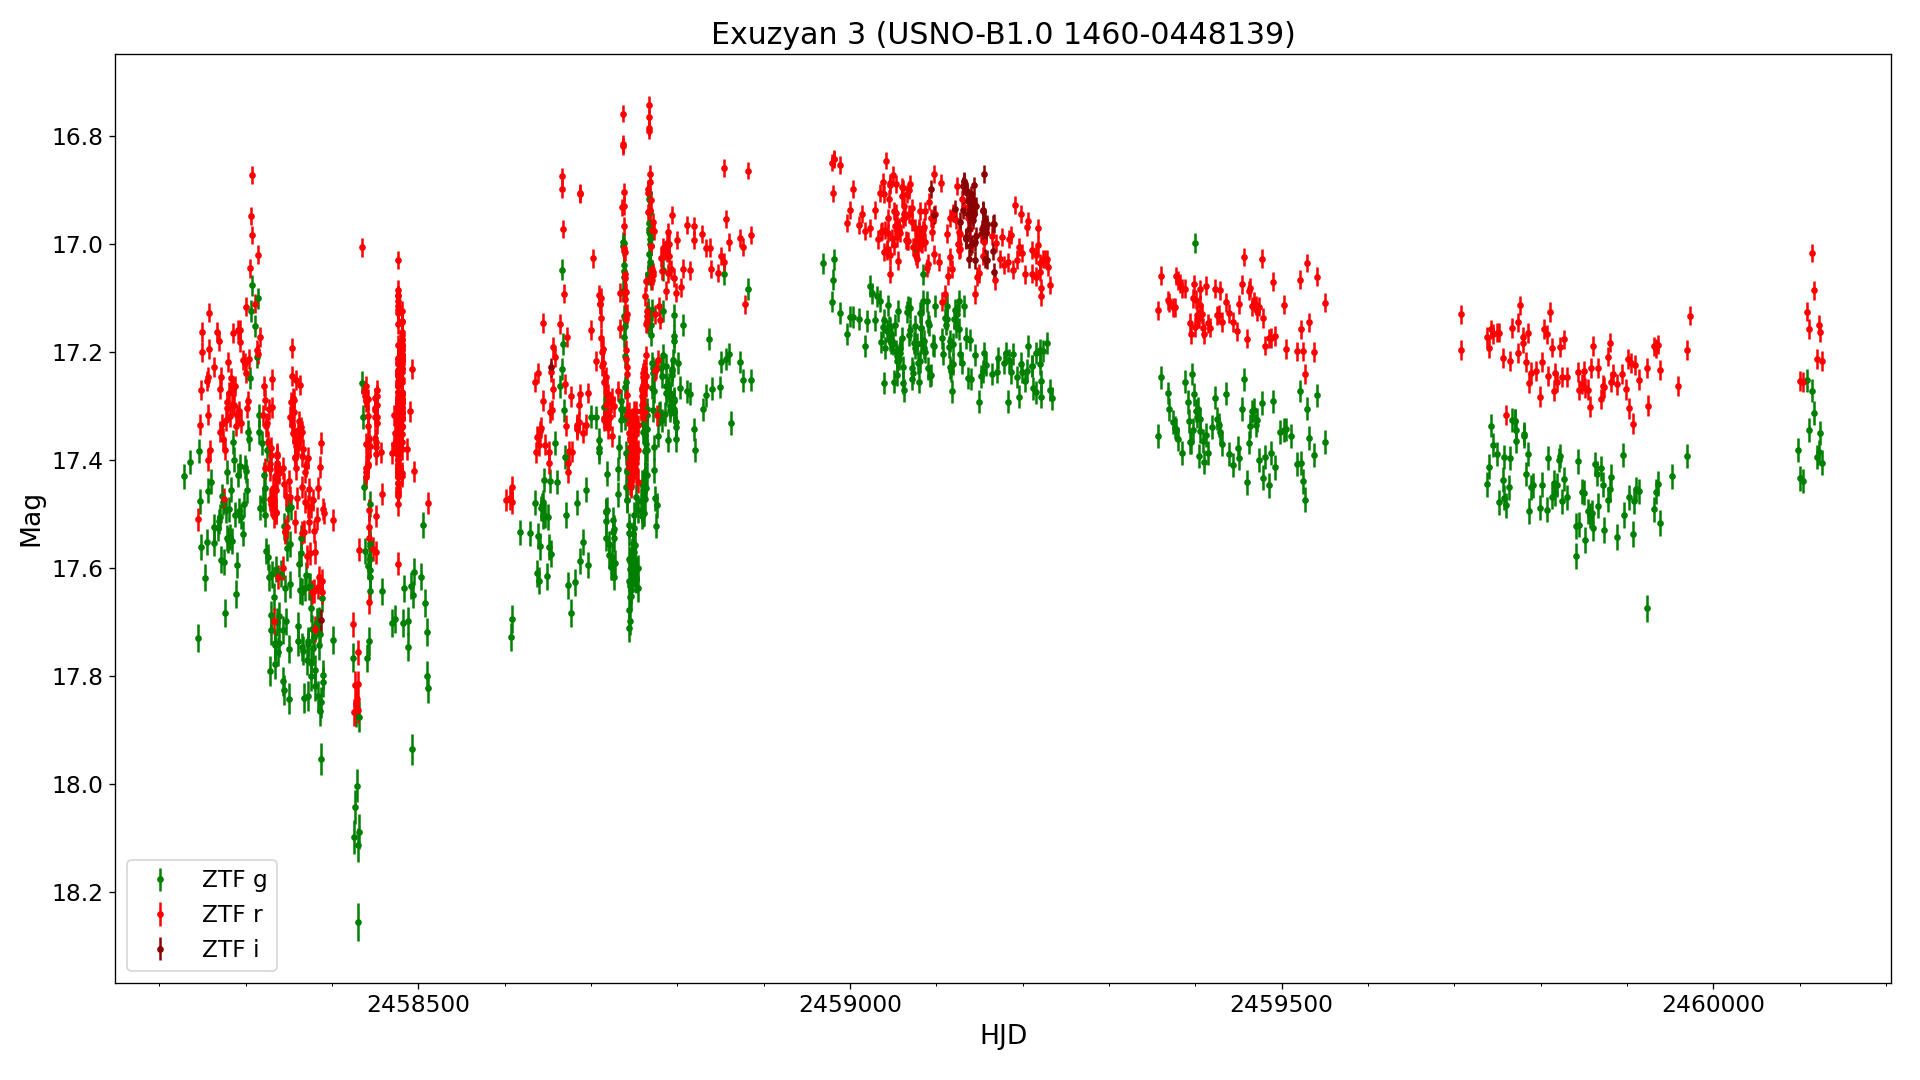
| 13 | Exuzyan 3 | USNO-B1.0 1460-0448139 | 23 19 15.81 +56 02 01.7 | NL | 16.9 | 18.2 g | g | Discovered during Moscow State University's LANAT summer camp. Light curve from ZTF data. | exuzyan3-ztf-lc.png exuzyan3-ztf-lc-vsx.png | exuzyan3-brir.jpg | exuzyan3-ztf-g.dat exuzyan3-ztf-r.dat ZTF18abblvfk | ||||
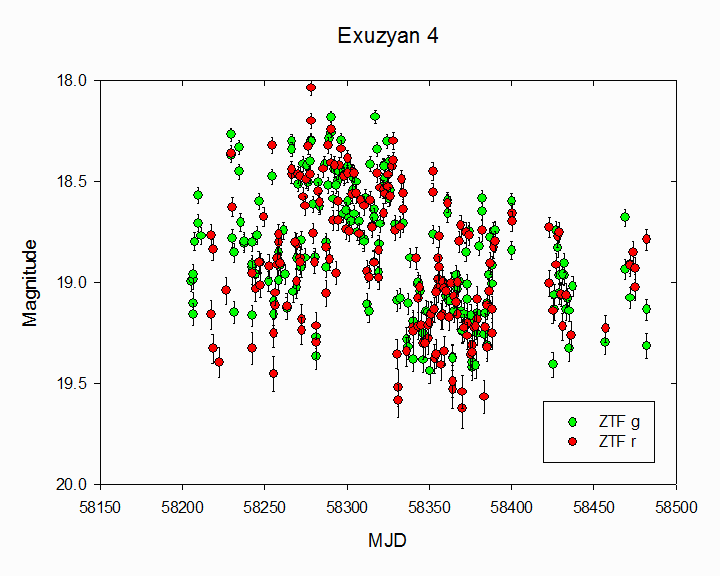
| 14 | Exuzyan 4 | USNO-B1.0 1269-0482362 | 20 43 35.40 +36 54 48.0 | CV | 18.1 | 21.4 r | r | em | Discovered during Moscow State University's LANAT summer camp. Light curve from ZTF data. | exuzyan4-ztf-lc-vsx.png exuzyan4-ztf-lc-vsx2.png | exuzyan4-gri5x5.jpg | exuzyan4-ztf-g.dat exuzyan4-ztf-r.dat ZTF18aazfitj | |||
| 15 | Mazepa 1 | USNO-B1.0 1457-0386987 | 22 07 09.64 +55 46 44.8 | UG | 17.7 | 21.0 g | g | Spectral type from 2008MNRAS.384.1277W? Light curve from ZTF and Pan-STARRS1 data. | mazepa1-ps1-lc.png | mazepa1-brir5x5.jpg | mazepa1-ztf-g.dat, mazepa1-ztf-r.dat | ||||
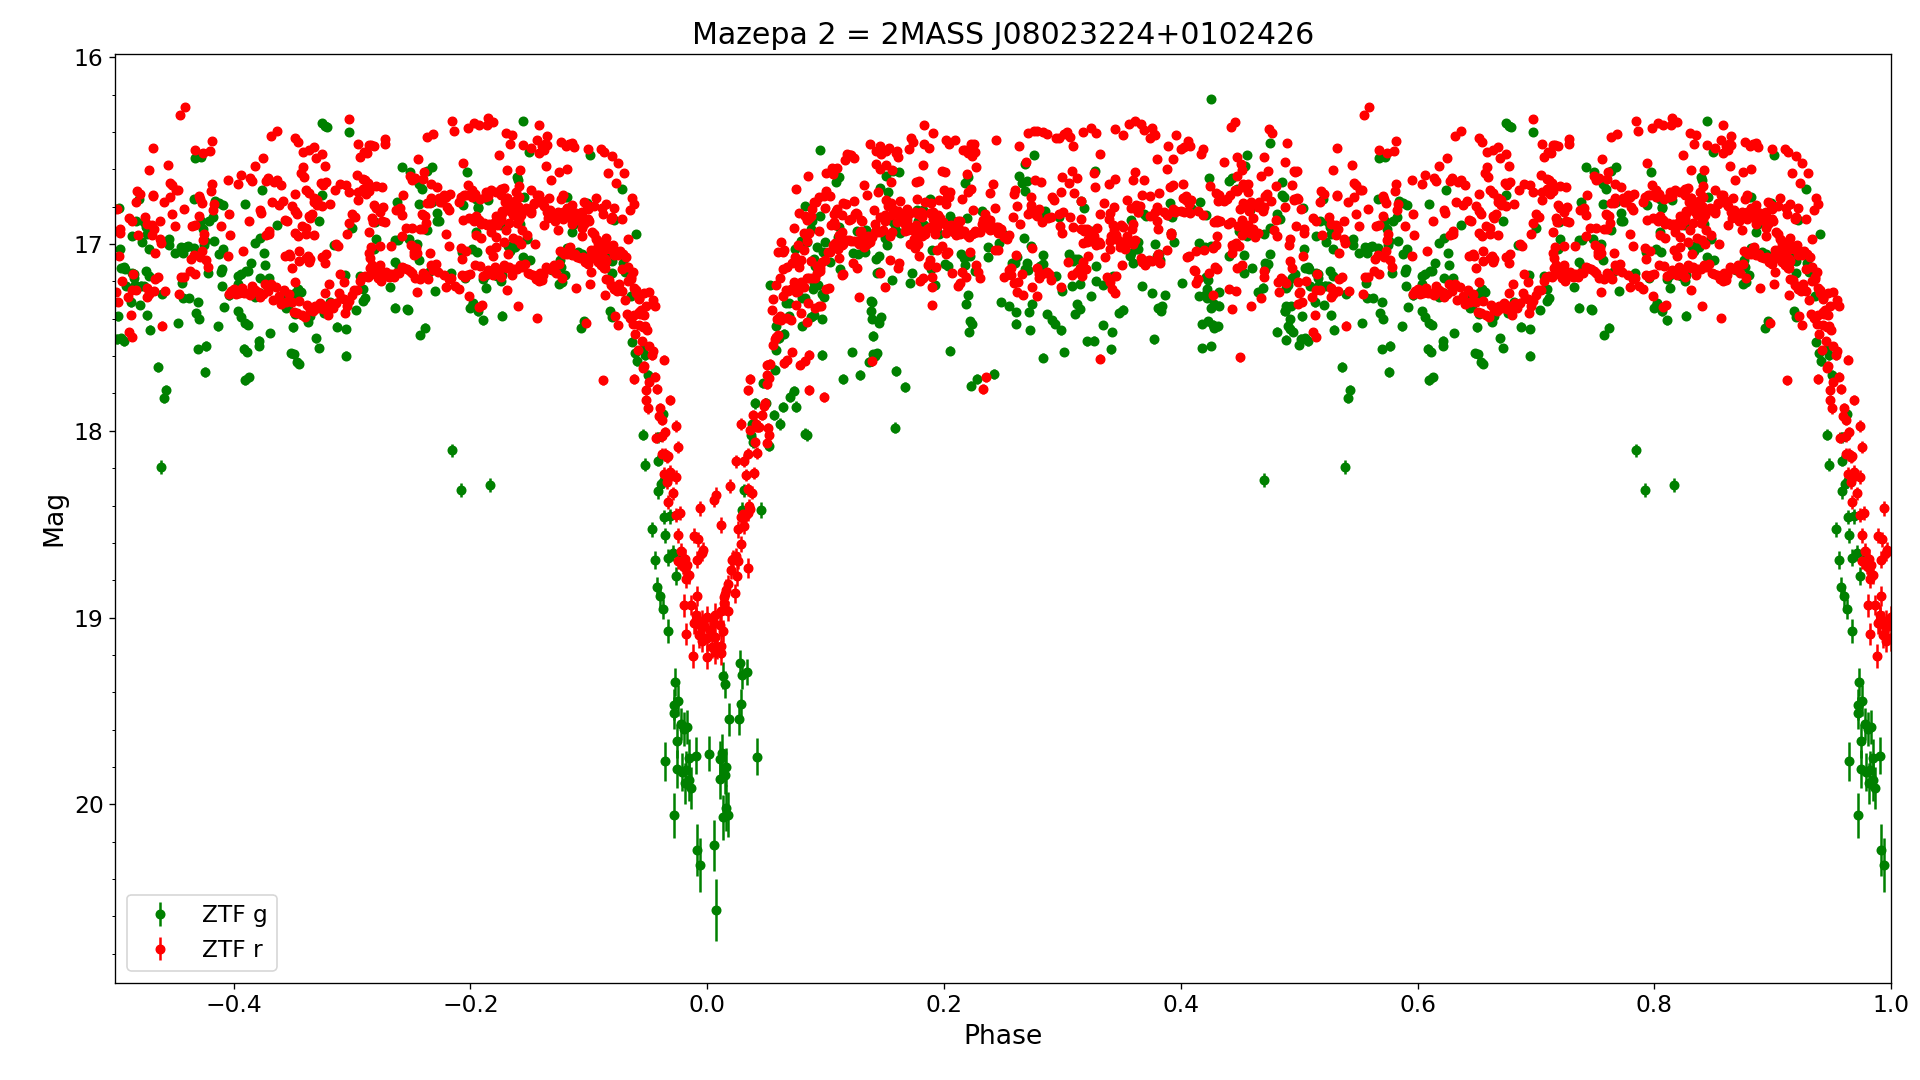
| 16 | Mazepa 2 | 2MASS J08023224+0102426, USNO-B1.0 0910-0158108 | 08 02 32.24 +01 02 42.4 | NL+E | 16.8 | 20.2: g | g | 0.2038603 d (4.8926 h) | 14 Sep 2021 (HJD 2459472.0002) | min | FUV-NUV=-0.04 (GALEX DR6). Eclipse on 1954-12-04 POSS-I Blue plate. Light curve from ZTF data in g and r filters folded with the best orbital period | mazepa2-ztf-phased-lc.png mazepa2-ztf-phased-lc-vsx.png | mazepa2-brir.jpg mazepa2-dss-blue-anim.gif | mazepa2-ztf-g.dat mazepa2-ztf-r.dat ZTF18aaabozq | |
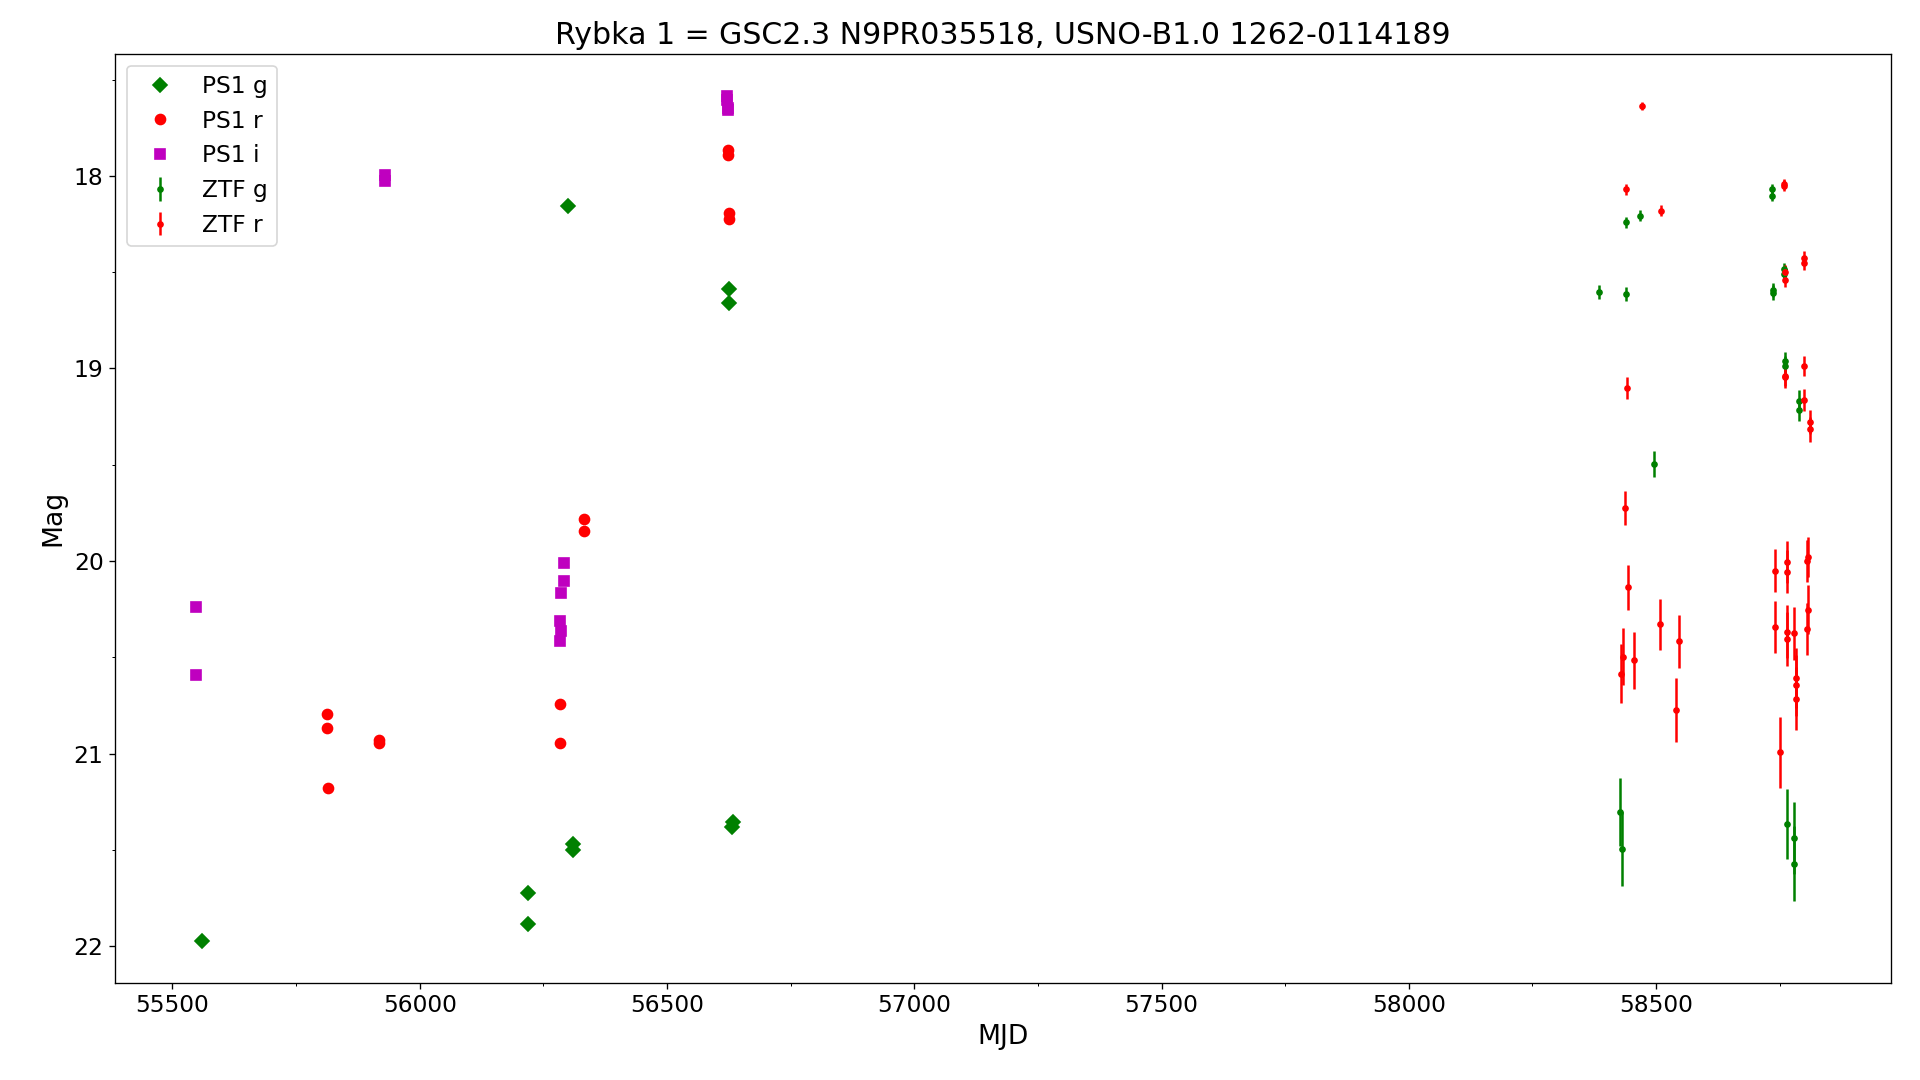
| 17 | Rybka 1 | GSC2.3 N9PR035518, USNO-B1.0 1262-0114189 | 05 49 22.95 +36 13 26.6 | UG | 17.8 | 21.6 r | r | em | Outbursts on 1986-12-29 blue and 1989-11-19 infrared DSS plates. Light curve from Pan-STARRS1 data. | rybka1-ps1-ztf-lc.png rybka1-ps-lc.png | rybka1-brir.jpg | rybka1-ztf-g.dat rybka1-ztf-r.dat, rybka1-psg.dat, rybka1-psr.dat, rybka1-psi.dat | |||
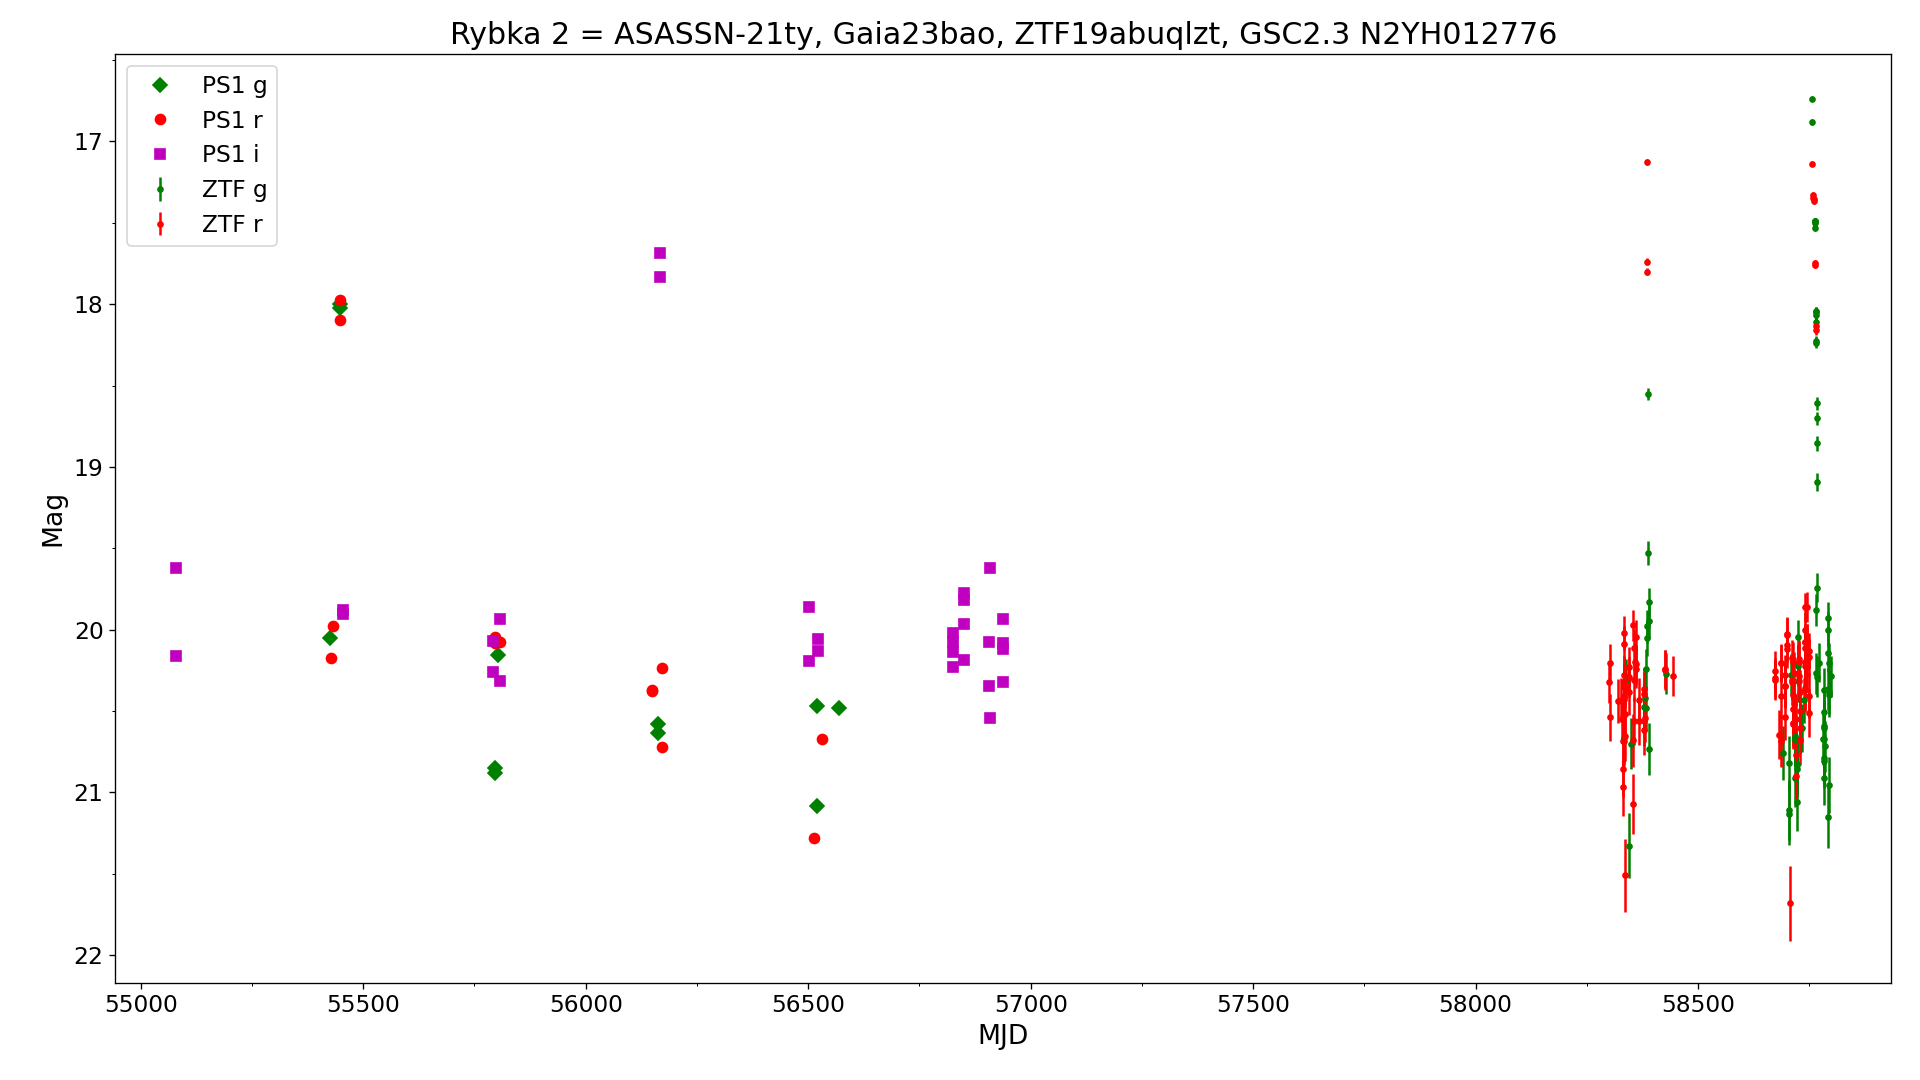
| 18 | Rybka 2 | ASASSN-21ty, Gaia23bao, ZTF19abuqlzt, GSC2.3 N2YH012776, USNO-B1.0 1304-0479600 | 22 31 37.46 +40 29 43.3 | UGSU+E | 16.3 | 21.1 g | g | 0.0819486 d (118.006 min) | 26 Oct 2021 (HJD 2459513.8834) | min | Outburst on 1989-09-03 DSS red plate. Minimum magnitude from ZTF data. Type, period and epoch from vsnet-alert 26459. Maximum magnitude from ASAS-SN Transients. Light curve from Pan-STARRS1 data. | rybka2-ps1-ztf-lc.png rybka2-ps1-lc-vsx.png | rybka2-brir.jpg | rybka2-ztf-g.dat rybka2-ztf-r.dat rybka2-psg.dat rybka2-psr.dat rybka2-psi.dat | |
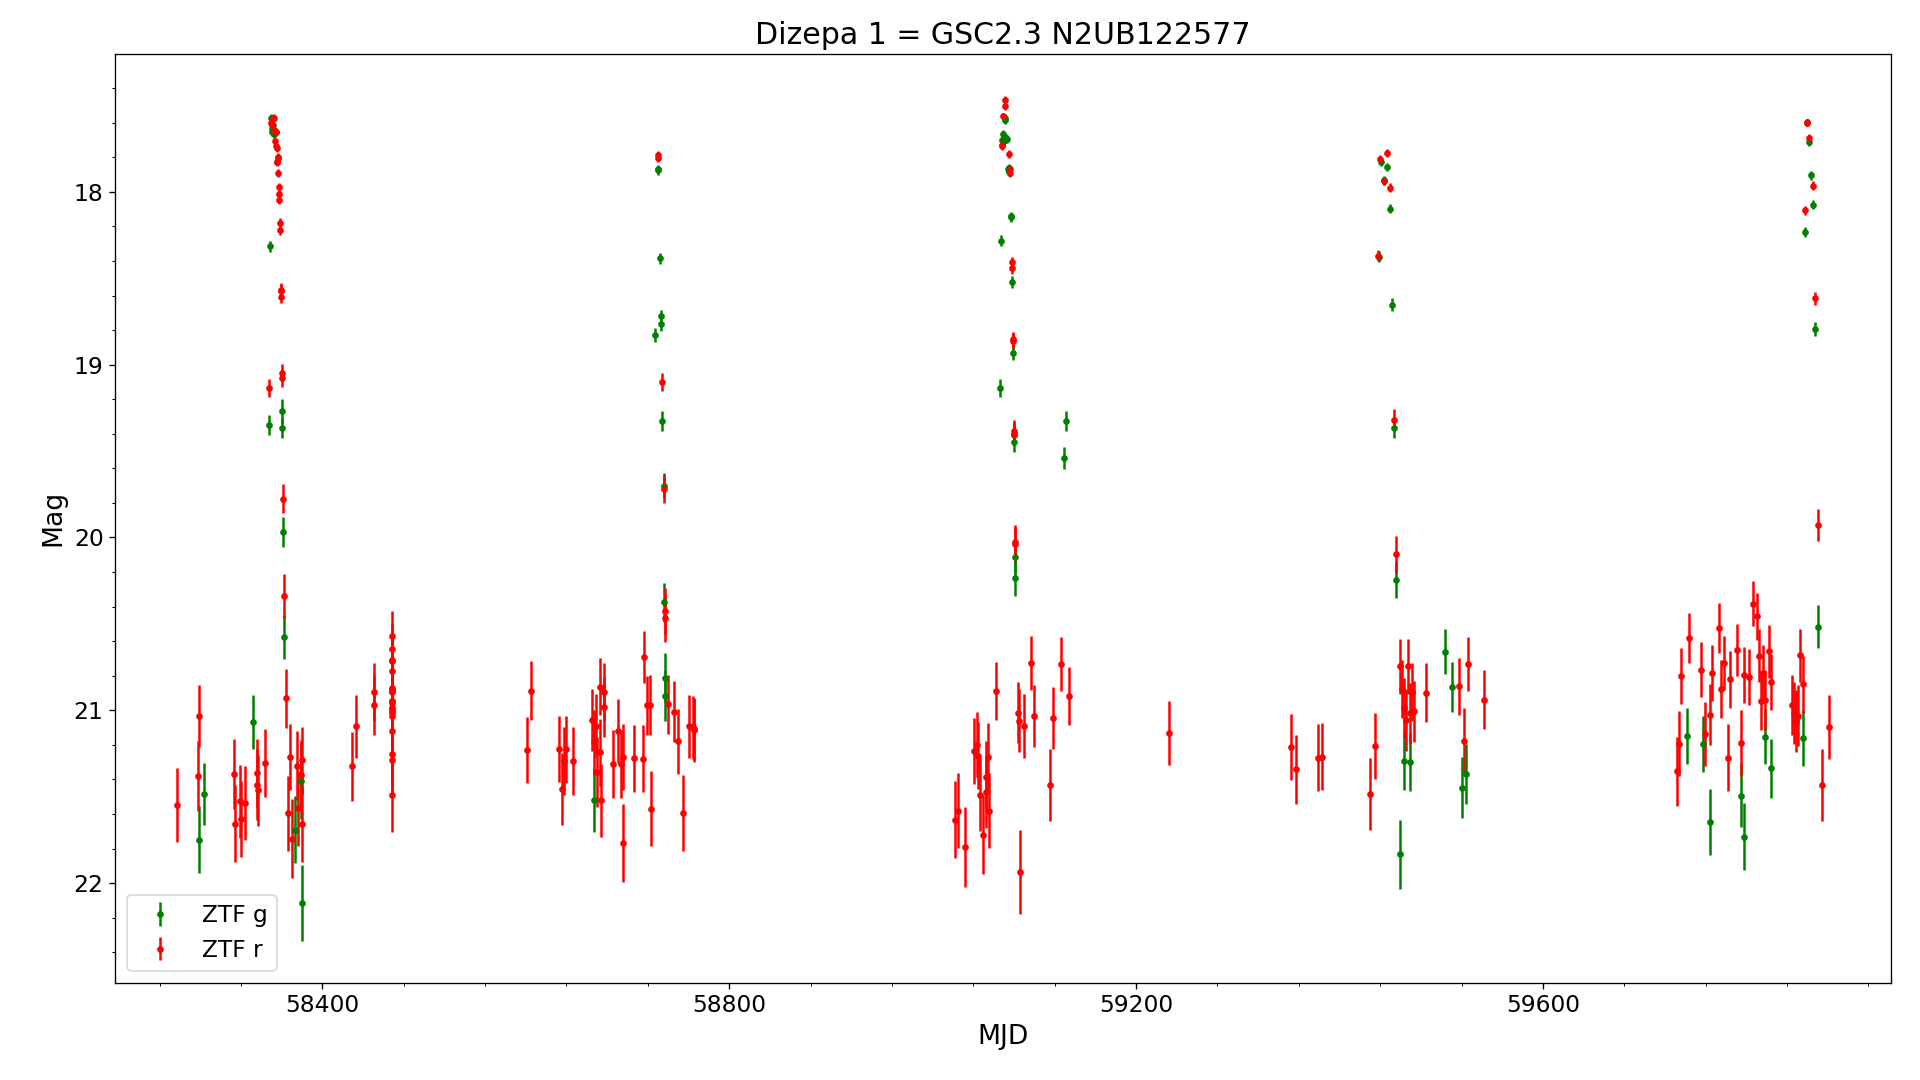
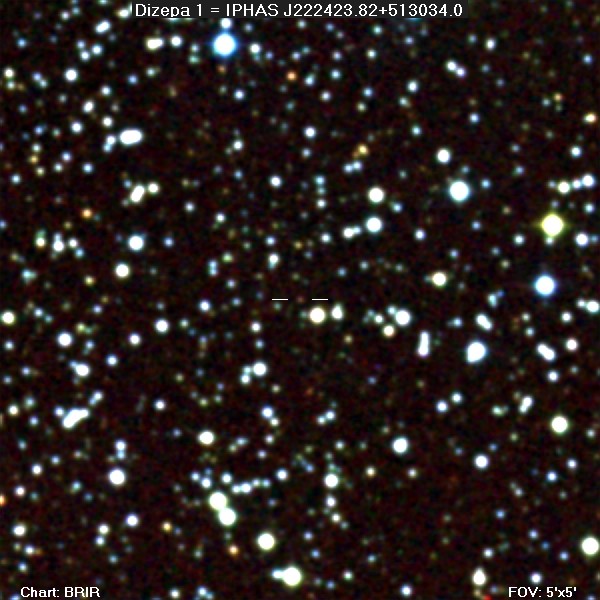
| 19 | Dizepa 1 | GSC2.3 N2UB122577 | 22 24 23.84 +51 30 34.0 | UG | 17.6 | 21.7 r | r | Type and range from ZTF data. Light curve from ZTF data | dizepa1-ztf-lc.png dizepa1-ztf-lc-vsx.png | dizepa1-brir5x5.jpg | dizepa1-ztf-g.dat dizepa2-ztf-r.dat ZTF18abnnidi | ||||
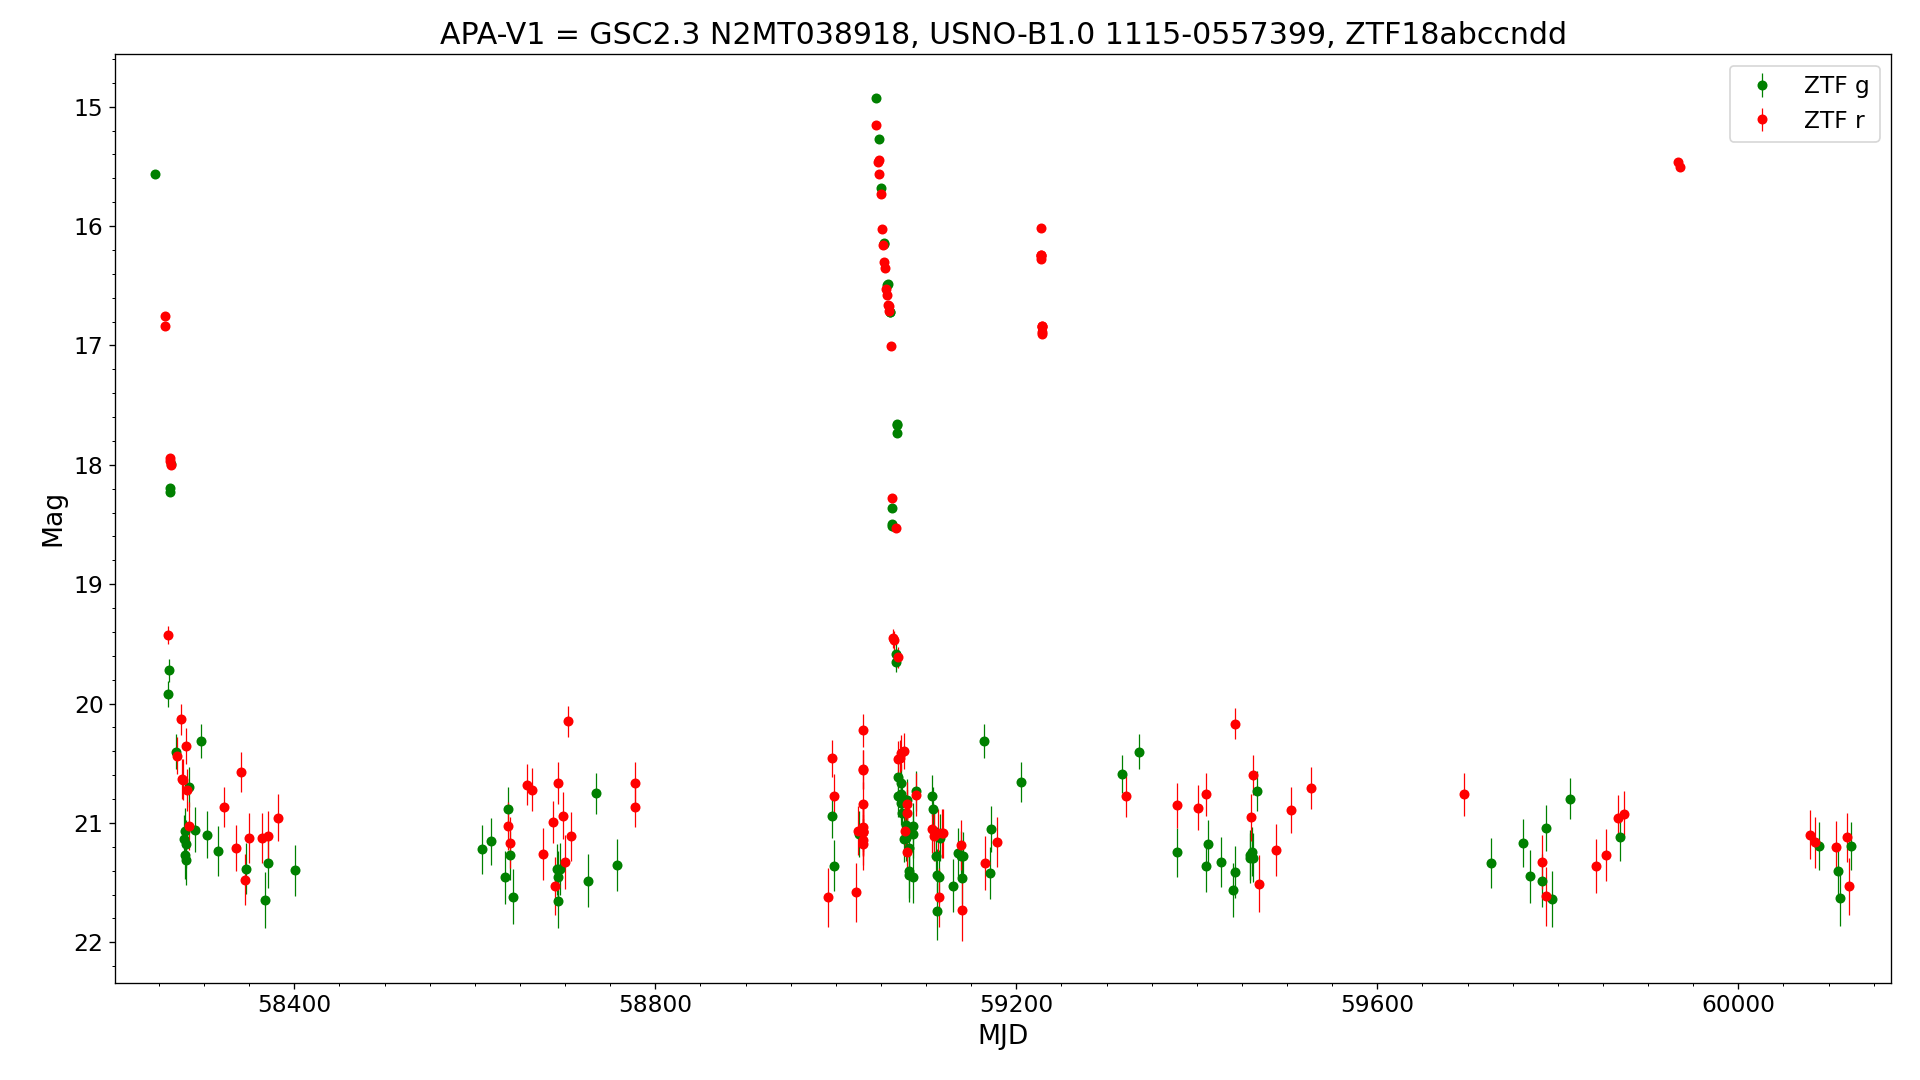
| 20 | APA-V1 | GSC2.3 N2MT038918, USNO-B1.0 1115-0557399, ZTF18abccndd | 21 20 09.80 +21 31 26.9 | UGSU: | 15.2 | 21.2 r | r | Type from vsnet-alert 27256. Range from ZTF data. Light curve from ZTF data | apa-v1-ztf-lc.png apa-v1-ztf-lc-vsx.png | apa-v1-brir5x5.jpg | apa-v1-ztf-g.dat apa-v1-ztf-r.dat ZTF18abccndd | ||||
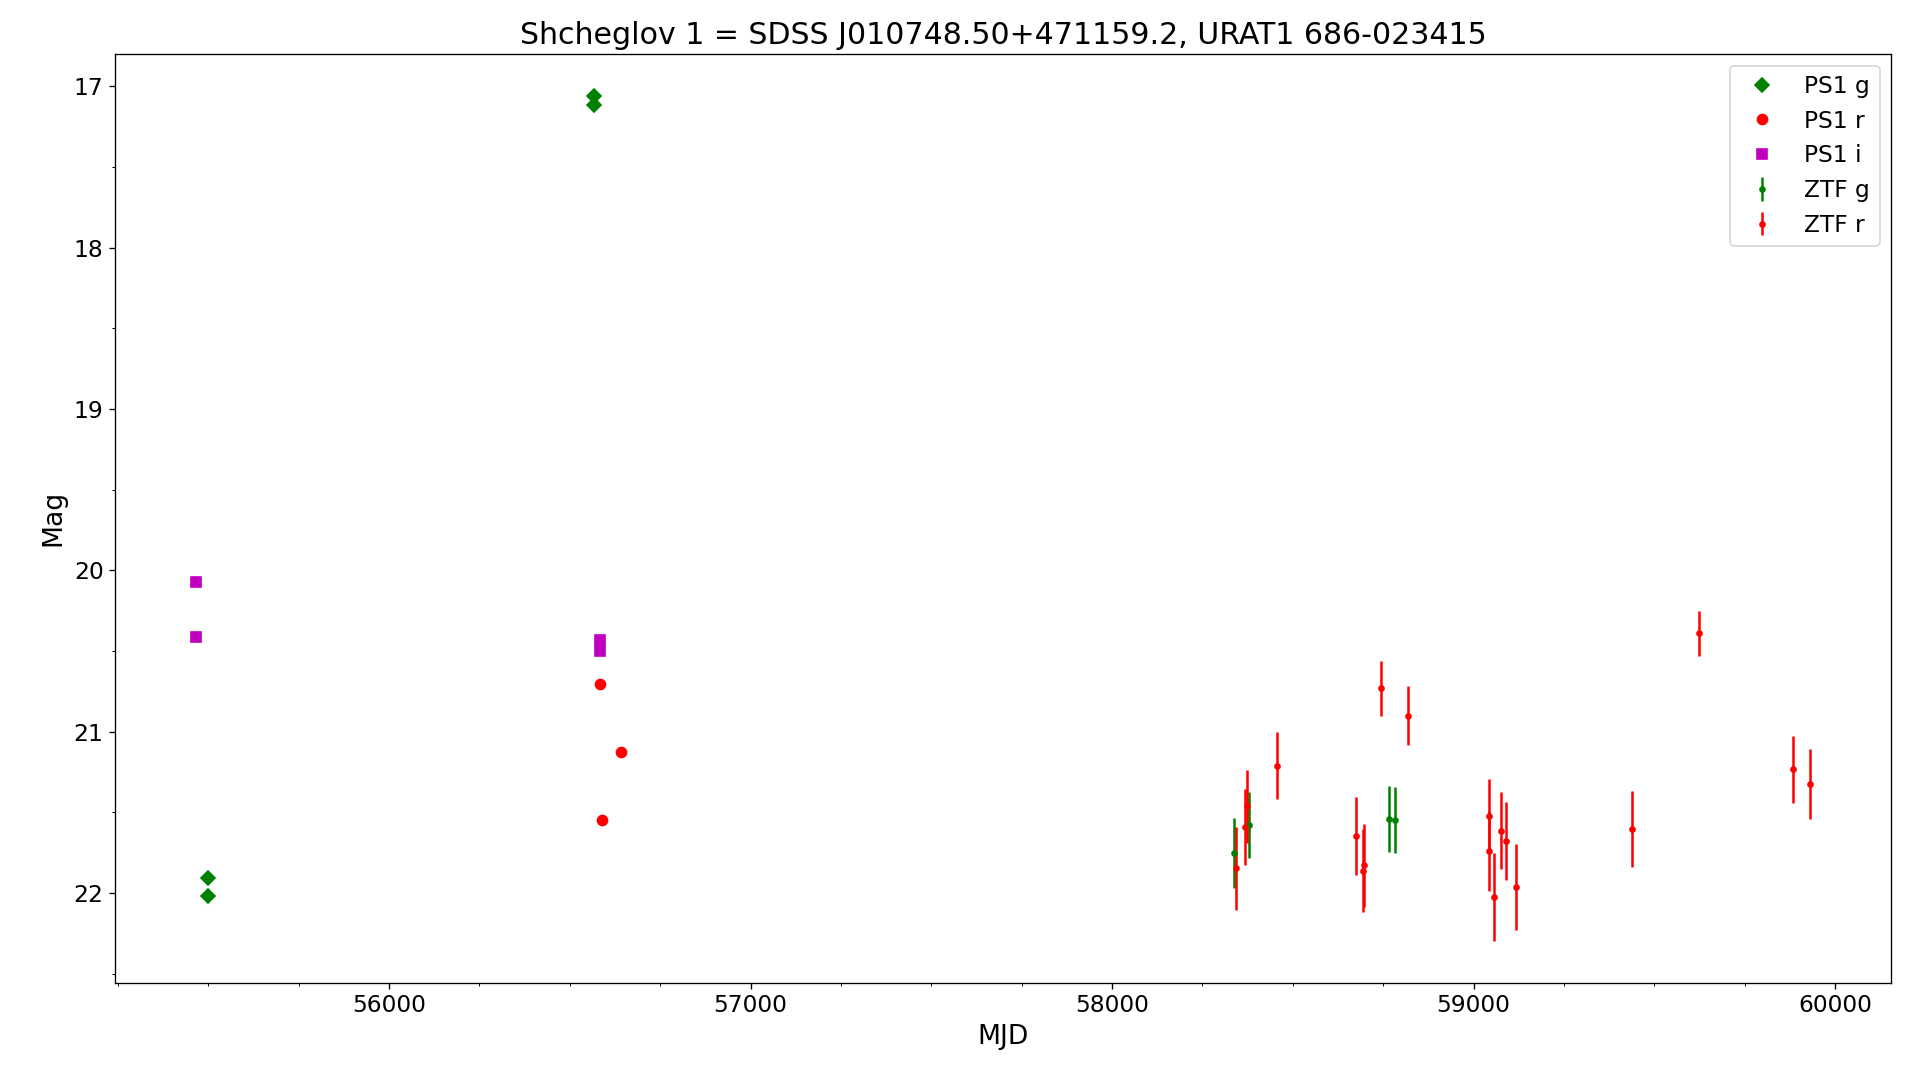
| 21 | Shcheglov 1 | SDSS J010748.50+471159.2, URAT1 686-023415 | 01 07 48.50 +47 11 59.2 | UG | 17.2 g | 21.8 r | g/r | Outburst on 2013 Oct. 02 Pan-STARRS1 images. Minimum magnitude from SDSS. Light curve from Pan-STARRS1 data | shcheglov1-ps1-lc.png shcheglov1-ps1-lc-vsx.png | shcheglov1-brir.jpg | shcheglov1-psg.dat shcheglov1-psr.dat shcheglov1-psi.dat | ||||
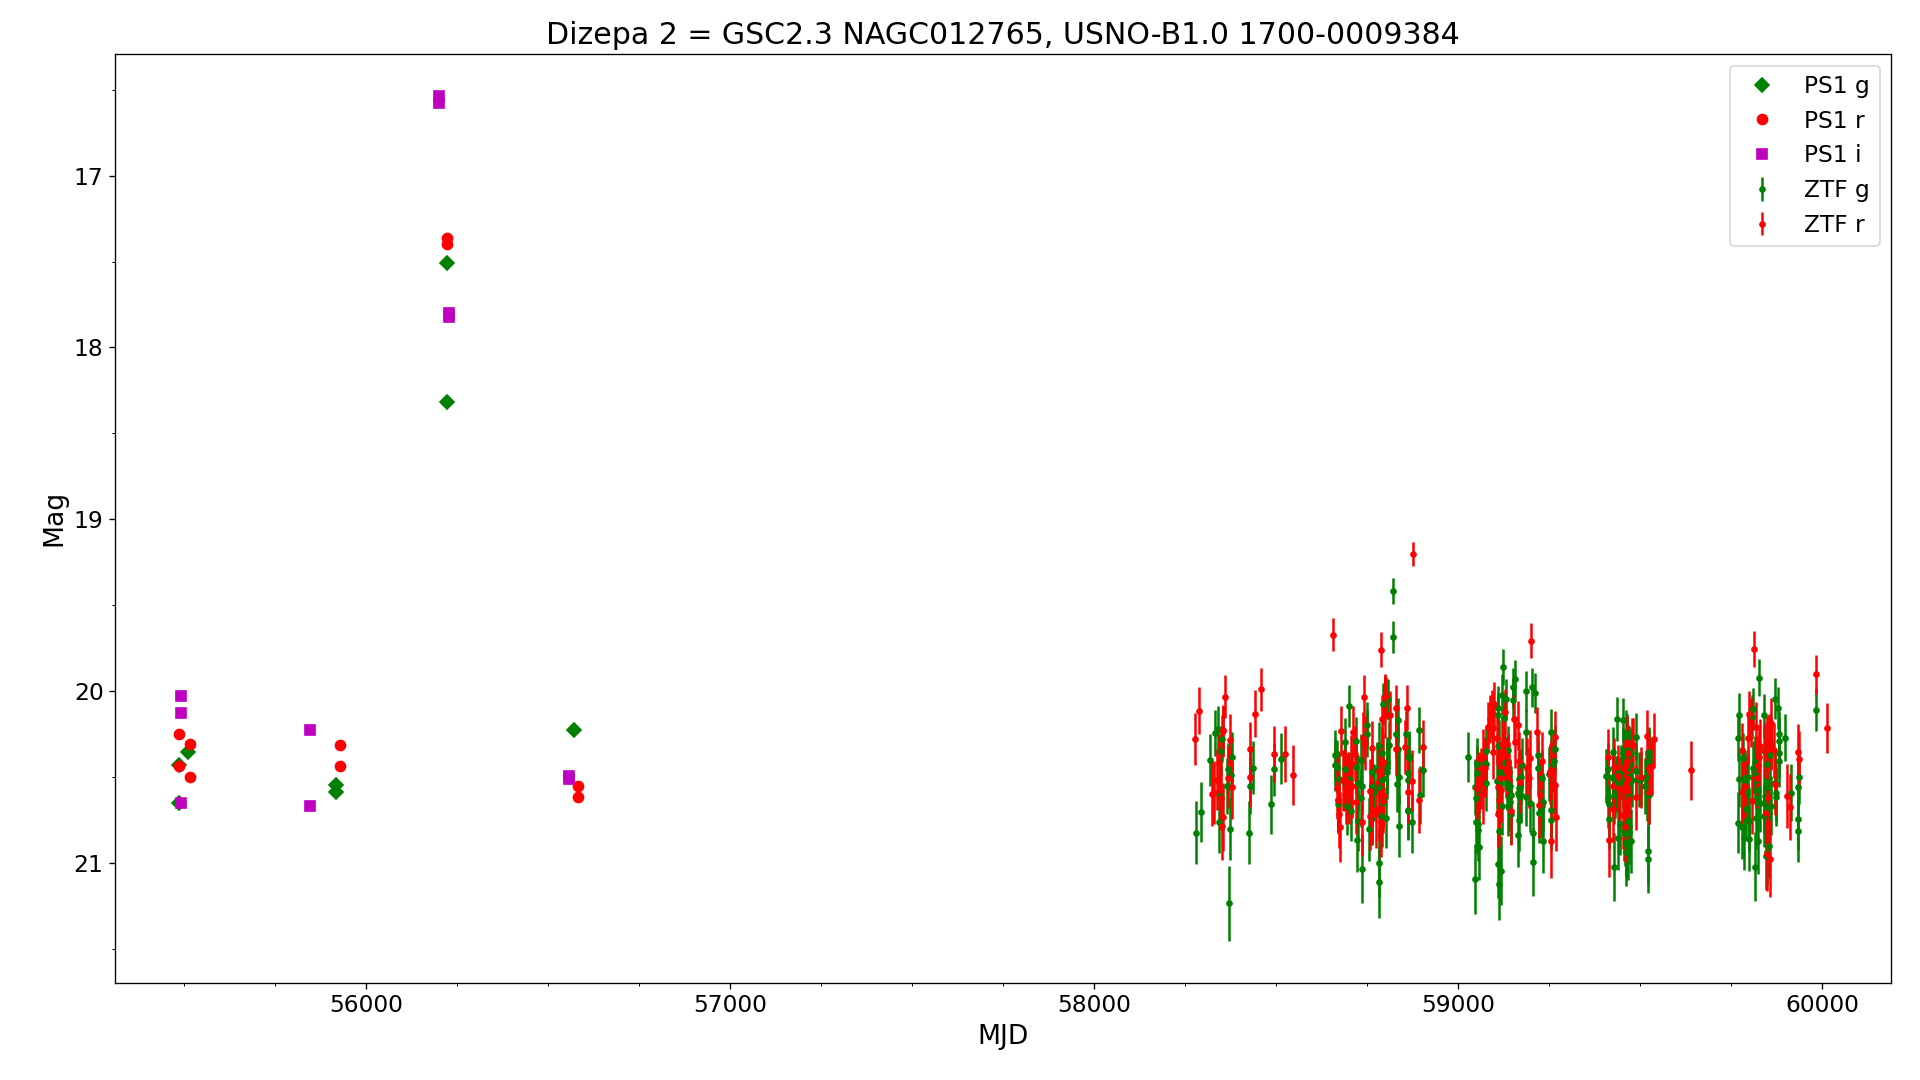
| 22 | Dizepa 2 | GSC2.3 NAGC012765, USNO-B1.0 1700-0009384 | 02 02 00.00 +80 00 48.7 | UG | 17.4 | 20.6 r | r | Light curve from Pan-STARRS1 data | dizepa2-ps1-ztf-lc.png dizepa2-ps1-lc-vsx.png | dizepa2-brir.jpg | dizepa2-psg.dat dizepa2-psr.dat dizepa2-psi.dat | ||||
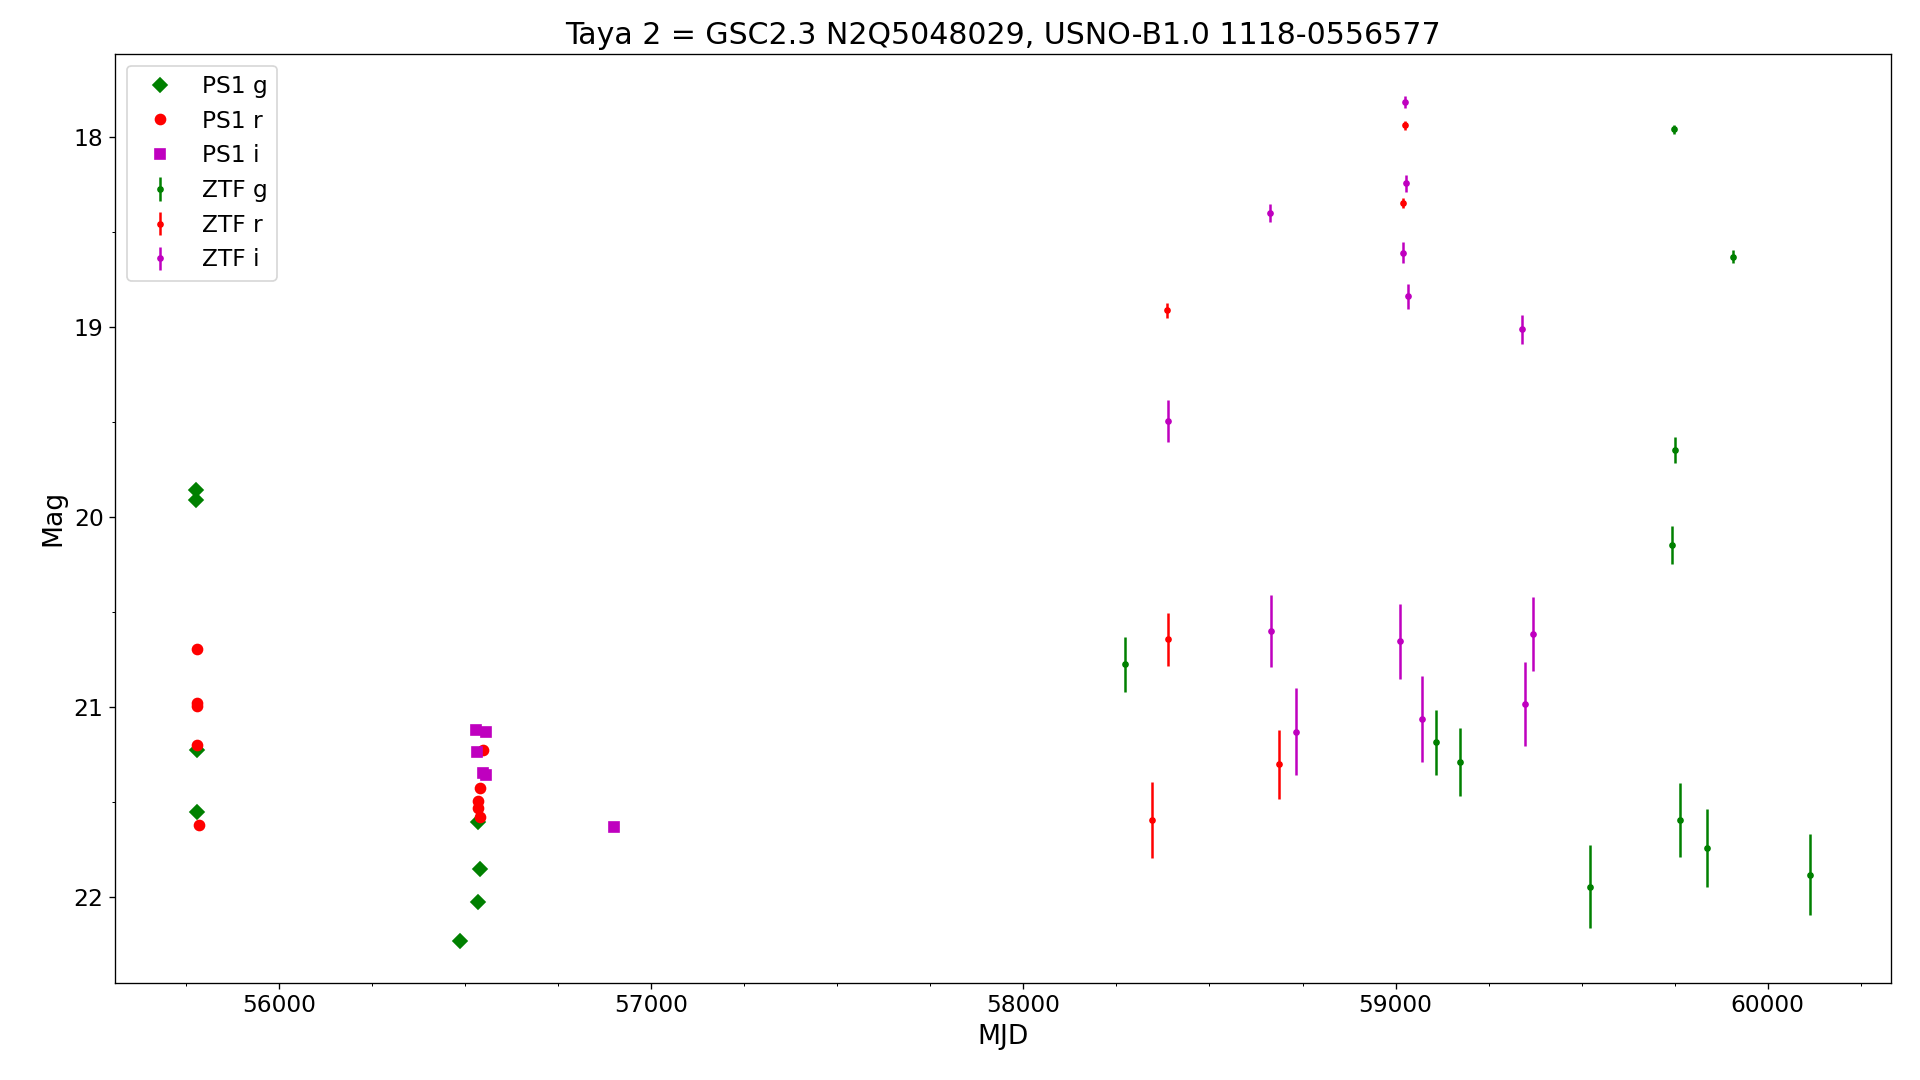
| 23 | Taya 2 | GSC2.3 N2Q5048029, USNO-B1.0 1118-0556577 | 21 01 30.22 +21 48 56.3 | UG | 18.3 g | 22.2 B | g/B | Maximum magnitude from ZTF data, minimum magnitude from GSC2.3. Light curve from Pan-STARRS1 and ZTF data | taya2-ps1-ztf-lc.png taya2-ps1-ztf-lc-vsx.png | taya2-brir5x5.jpg | taya2-ztf-g.dat taya2-ztf-r.dat taya2-ztf-i.dat taya2-psg.dat taya2-psr.dat taya2-psi.dat | ||||
| 24 | Minkovskiy 1 | GSC2.3 N2PF083436 | 20 36 39.38 +20 17 43.6 | UG | 17.0 R | 22.7 i | R/i | Discovered by 9th-grade student Artur Minkovskiy on DSS images. Outburst on 1992-08-31 POSS-II Red plate. Another outburst on 2011 July 19 - Aug. 06 Pan-STARRS1 images. Maximum magnitude from GSC2.3. Minimum magnitude from Pan-STARRS1. PanSTARRS-1 light curve of Minkovskiy 1 in g, r and i filters | minkovskiy1-ps-lc.png | minkovskiy1-2-brir.jpg | minkovskiy1-psg.dat minkovskiy1-psr.dat minkovskiy1-psi.dat | ||||
| 25 | Minkovskiy 2 | GSC2.3 N2PD005009, USNO-B1.0 1103-0549124, ZTF18abktuwb | 20 36 28.42 +20 19 26.6 | UGZ/IW | 16.8 | 21.5 | g | Discovered by 9th-grade student Artur Minkovskiy on DSS plates 3' WNW of Minkovskiy 1. Type and period in 2017AJ....153..204S are incorrect. Light curve of Minkovskiy 2 from ATLAS data in c and o filters. Light curve of Minkovskiy 2 from ZTF data in g and r filters. | minkovskiy2-atlas-lc.png minkovskiy2-ztf-lc.png | minkovskiy1-2-brir.jpg | ZTF18abktuwb, ZTF18adqqrtm | ||||
| 26 | Minkovskiy 3 | GSC2.3 N24L032316, ZTF18abbxjgd | 18 43 20.52 +29 12 48.9 | UG | 17.9 | 21.7 r | r | Outburst on 1989-05-04 POSS-II Red plate. Range from ZTF data. Light curve from ZTF data in g and r filters | minkovskiy3-ztf-lc.png | minkovskiy3-brir.jpg | ZTF18abbxjgd | ||||
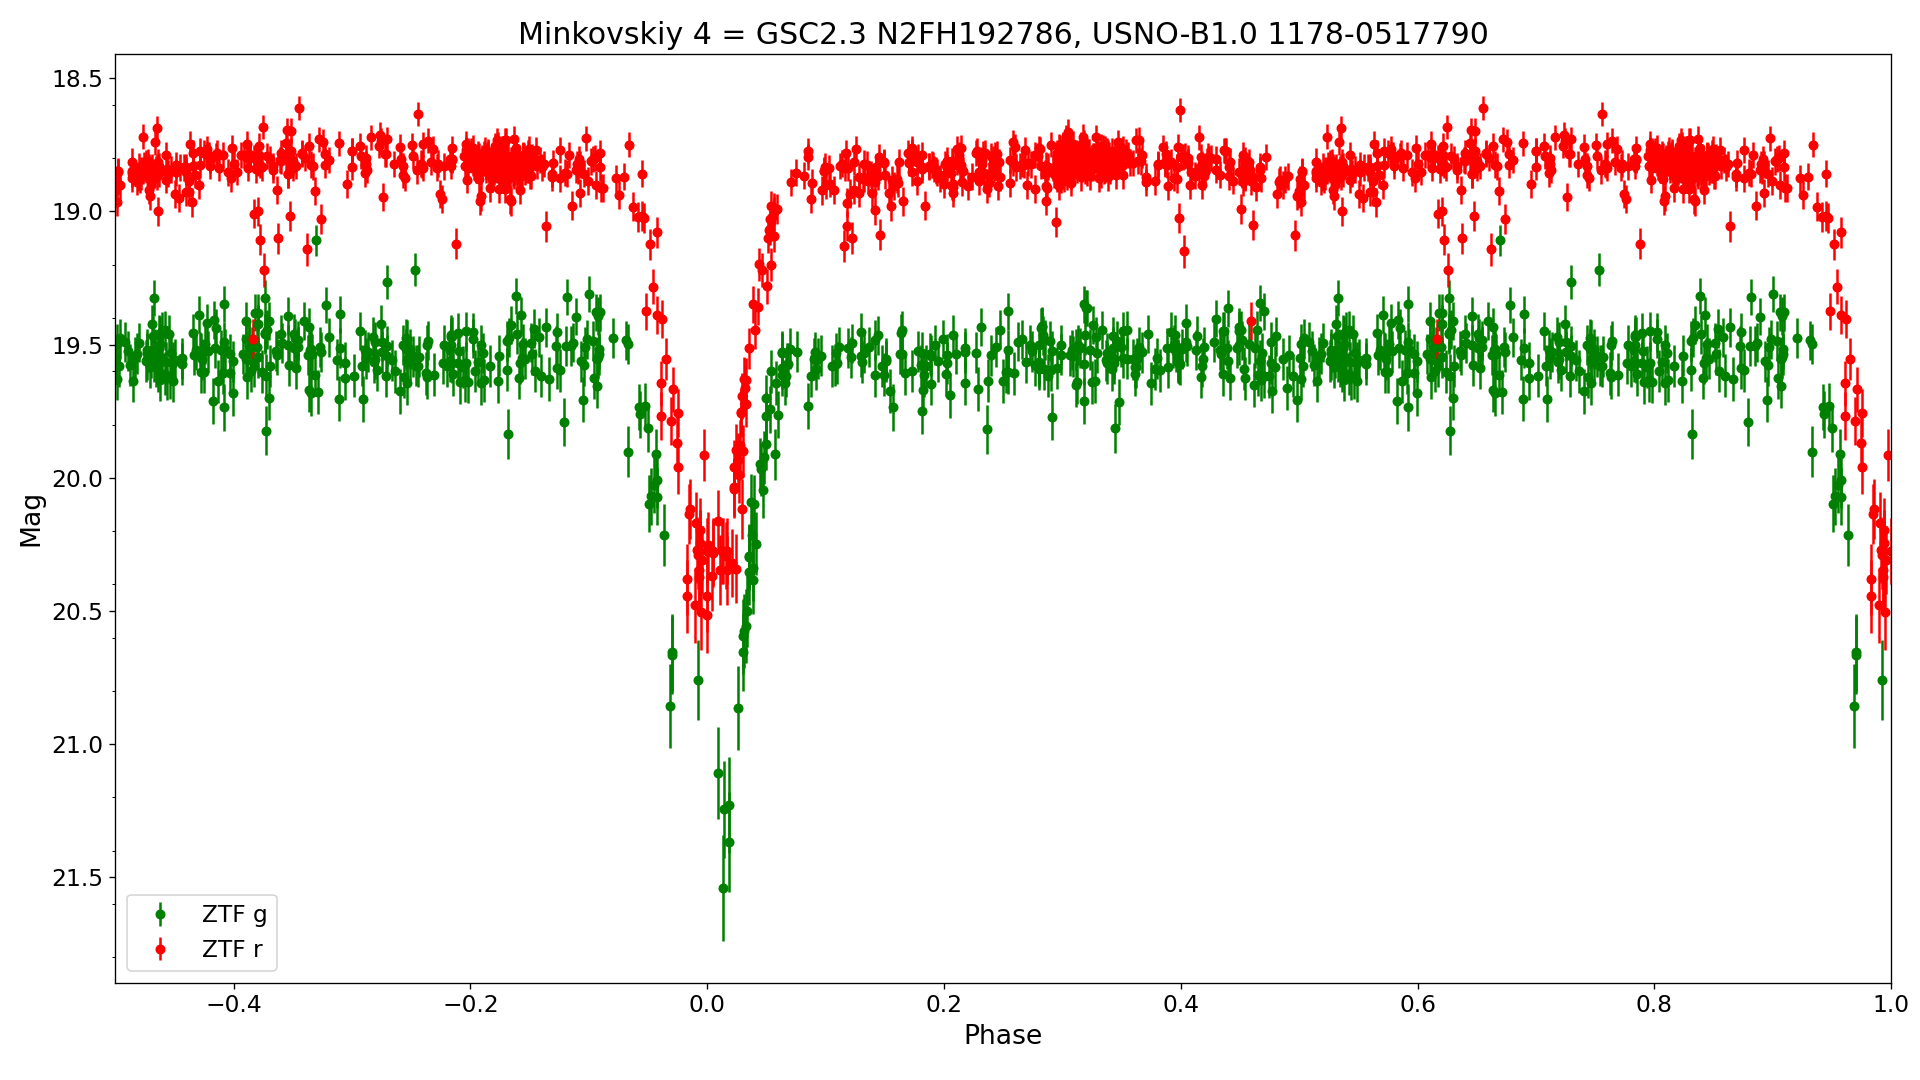
| 27 | Minkovskiy 4 | GSC2.3 N2FH192786, USNO-B1.0 1178-0517790 | 19 38 13.32 +27 53 03.8 | EA | 18.8 | 20.4 r | r | 2.003715 (2.003723) d | 09 May 2018 (HJD 2458247.954) | min | Eclipse on 1988-07-14 POSS-II Blue plate. Light curve from ZTF DR5 folded with the best orbital period | minkovskiy4-ztf-phased-lc.png minkovskiy4-ztf-phased-lc-vsx.png | minkovskiy4-brir5x5.jpg | minkovskiy4-ztf-g.dat minkovskiy4-ztf-r.dat | |
| 28 | Minkovskiy 5 | 2MASS J18335246+0644492, GSC2.3 N1RY045562, USNO-B1.0 0967-0400894 | 18 33 52.48 +06 44 49.3 | EA | 17.4 | 18.8 r | r | 1.68741 d | 02 Jul 2019 (HJD 2458667.166) | min | Light curve from ZTF DR5 folded with the best period | minkovskiy5-ztf-phased.png | minkovskiy5-brir.png | ||
| 29 | Minkovskiy 6 | 2MASS J18162799+0319295, GSC2.3 N1MN075300 | 18 16 27.99 +03 19 29.6 | EA/WD | 17.41 | 17.73 r | r | 0.2428935 d (5.82944 h) | 25 Jan 2019 (HJD 2458509.09) | min | Min II = 17.56r. FUV-NUV = -0.22 (GALEX). Light curve from ZTF DR5 folded with the best orbital period | minkovskiy6-ztf-phased.png | minkovskiy6-brir5x5.jpg | ||
| 30 | Shcheglov 3 | GSC2.3 S90L033946 | 15 26 27.34 -23 01 43.4 | UG | 17.6 B | 22.7 r | B/r | Outburst on 1976-05-21 Blue DSS plate. Maximum magnitude from GSC2.3. Minimum magnitude from Pan-STARRS1 | -- | shcheglov3-jrir.jpg shcheglov3-gri2x2.jpg | |||||
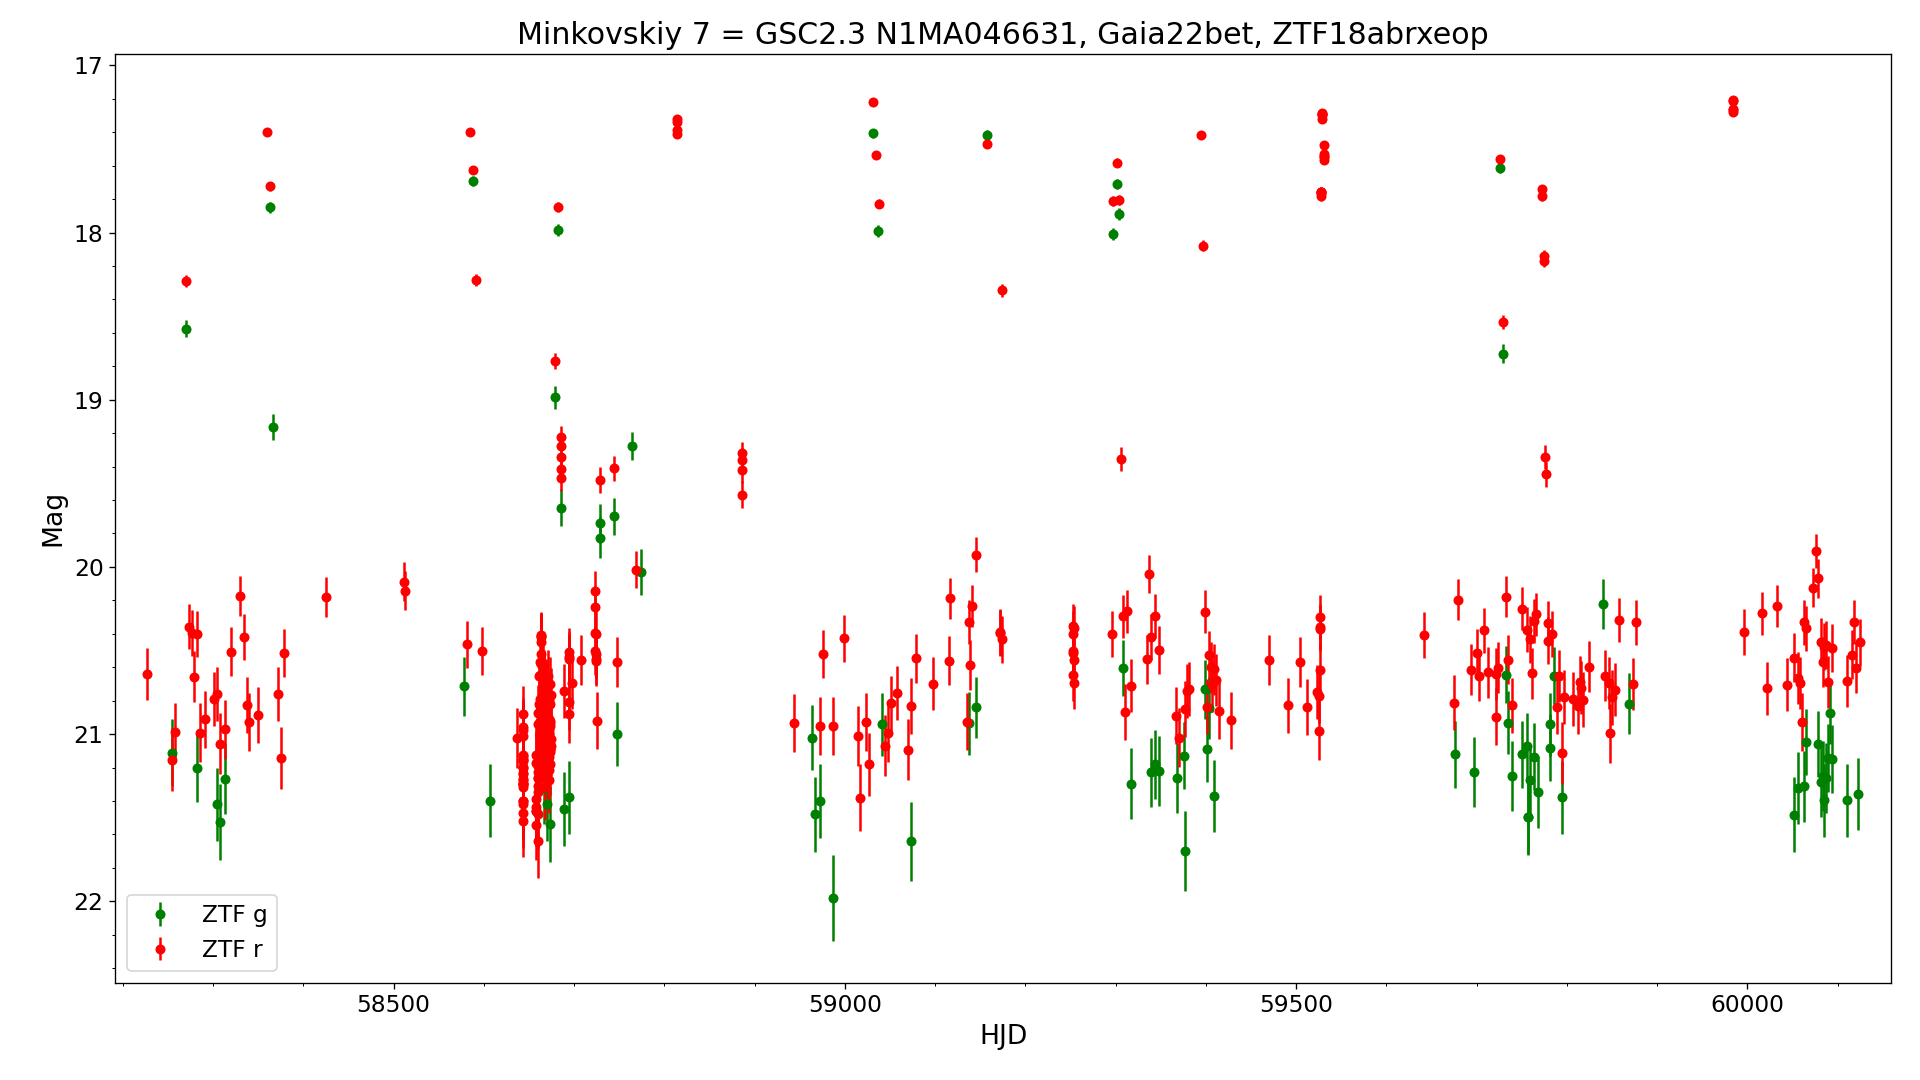
| 31 | Minkovskiy 7 | GSC2.3 N1MA046631, Gaia22bet, ZTF18abrxeop | 18 18 19.78 +03 58 15.0 | UG | 17.2 | 21.5 r | r | Outburst on 1993-05-27 POSS-II Red plate. Light curve from ZTF data in g and r filters | minkovskiy7-ztf-lc.png minkovskiy7-ztf-lc-vsx-wrong-title.png | minkovskiy7-brir.jpg | minkovskiy7-ztf-g.dat minkovskiy7-ztf-r.dat ZTF18abrxeop | ||||
| 32 | Minkovskiy 8 | 2MASS J18153954+0534220, GSC2.3 N1M9059733, USNO-B1.0 0955-0346725 | 18 15 39.55 +05 34 22.0 | EA | 16.4 | 18.2 r | r | 1.875252 d | 28 Jan 2019 (HJD 2458511.519) | min | Eclipse on 1993-05-27 POSS-II Red plate. Period and range from ZTF DR5. Light curve from ZTF DR5 folded with the best period | minkovskiy8-ztf-phased.png | minkovskiy8-brir-10x10.png | ||
| 33 | Minkovskiy 9 | 2MASS J17451072-1850332, GSC2.3 S809006801, USNO-B1.0 0711-0487576 | 17 45 10.72 -18 50 33.2 | M | 13.6 | 17.2 o | o | 380 d | 07 Nov 2020 (HJD 2459161) | max | Light curve folded with the best period. Light curve from ATLAS data | minkovskiy9-atlas-lc.png minkovskiy9-atlas-phased.png | minkovskiy9-brir.jpg | minkovskiy9-atlas-o-cleaned-0.5magerr.dat | |
| 34 | Minkovskiy 10 | GSC2.3 N24J020387, ZTF18absaric | 18 47 49.12 +25 33 09.2 | UG | 17.8 | 21.4 g | g | Light curve from ZTF data in r and g filter | minkovskiy10-lc.png | minkovskiy10-brir.jpg | ZTF18absaric | ||||
| 35 | Minkovskiy 11 | 2MASS J19451406+3329280, GSC2.3 N2GT212052, USNO-B1.0 1234-0390122 | 19 45 14.06 +33 29 28.6 | EA | 18.3 | 20.7 g | g | 2.643264 d | 15 May 2019 (HJD 2458619.412) | min | Light curve from ZTF DR7 folded with the best orbital period | minkovskiy11-ztf-phased.png | minkovskiy11-brir-7x7.jpg | ||
| 36 | Minkovskiy 12 | GSC2.3 N2GT210710, USNO-B1.0 1234-0391099 | 19 45 29.06 +33 28 15.6 | UG | 15.4 g | 19.8 G | g/G | Minimum magnitude from Gaia DR2. Light curve from Pan-STARRS1 data in g, r and i filters | minkovskiy12-ps1-lc.png | minkovskiy12-brir5x5.jpg | |||||
| 37 | Minkovskiy 13 | GSC2.3 N2GM152534 | 19 33 27.00 +32 52 49.2 | UG | 18.2 | 22.8: r | r | Outburst on 1988-06-12 POSS-II blue plate. Minimum magnitude from Pan-STARRS1. Light curve from ZTF data in r filter | minkovskiy13-ztf-lc.png | minkovskiy13-brir.png | |||||
| 38 | DAV V1 | Lee 284, 2MASS J05475413+5023364, DO 29668, USNO-B1.0 1403-0161780 | 05 47 54.12 +50 23 36.6 | L | 10.4 | 11.4 V | V | C5+,4 | Spectral type from 1997ApJS..112..557K. Combined light curve from ASAS-SN and ZTF data | davv1-asassn-ztf-lc.png | davv1-brir.jpg | ||||
| 39 | DAV V2 | GSC2.3 N7JO002290 | 11 26 35.53 +49 25 04.3 | UG | 15.1 B | <23 g | B/g | Outburst on 1995-04-24 POSS-II blue plate. Maximum magnitude from GSC2.3. Minimum magnitude from Pan-STARRS1 images. | -- | davv2-br.jpg | |||||
| 40 | DAV V3 ATO J073.5027+54.5420 | 2MASS J04540067+5432313, USNO-B1.0 1445-0143313 | 04 54 00.67 +54 32 31.3 | SR | 13.0 | 13.4 r | r | 38.7 d | 12 Sep 2020 (HJD 2459105.0) | max | Light curve from ZTF data in g and r filters. Light curve from ZTF data folded with the best pulsation period | davv3-ztf-lc.png davv3-ztf-phased_lc.png | davv3-brir.jpg | ||
| 41 | Lisniak 1 | 2MASS J18152196+0547464, GSC2.3 N1M2013208, USNO-B1.0 0957-0347391 | 18 15 21.97 +05 47 46.6 | SR | 14.4 | 15.1 r | r | 59.6 d | 23 Jul 2020 (HJD 2459054.0) | max | J-K= 1.4 (2MASS). Light curve from ZTF DR8 folded with the best pulsation period. Light curve from ZTF DR8 showing long-term variations. | lisniak1-ztf-phased_lc.png lisniak1-ztf-lc.png | lisniak1-brir5x5.jpg | ||
| 42 | Kachalin 3 | 2MASS J18152230+0544236, USNO-B1.0 0957-0347396 | 18 15 22.31 +05 44 23.7 | BY | 16.5 | 16.7 r | r | 6.801 d | 29 Sep 2018 (HJD 2458390.62) | min | Light curve from ZTF data folded with the best period. Light curve from ZTF data in g and r filters | kachalin3-ztf-lc.png kachalin3-phased_lc.png | kachalin3-brir5x5.jpg | ||
| 43 | Minkovskiy 14 | GSC2.3 N2JL076237, USNO-B1.0 1267-0332999, ZTF19aaumqle | 19 13 49.42 +36 44 25.7 | UGSU: | 17.5 | 21.4 r | r | Outburst on 1989-07-01 POSS-II Blue plate. Light curve from ZTF data in r and g filters. | minkovskiy14-ztf-lc.png | minkovskiy14-brir.png | ZTF19aaumqle | ||||
| 44 | KazakevichOA 1 | GSC2.3 N1YT062448, Gaia21fpv, ZTF19aavhrup | 20 00 02.87 +10 27 37.2 | UG | 17.3 | <23 r | r | Outburst on 1991-07-17 POSS-II red plate. Maximum magnitude from ZTF (Lasair) data. Minimum magnitude from Pan-STARRS1 images. | -- | kazakevichoa1-brir5x5.jpg | ZTF19aavhrup | ||||
| 45 | Minkovskiy 15 | 2MASS J18420998+1305215, GSC2.3 N28J098717, USNO-B1.0 1030-0398784, ZTF18ablnbgx | 18 42 09.98 +13 05 21.7 | EA | 17.42 | 18.2 r | r | 1.3870743 d | 17 Oct 2019 (HJD 2458773.595) | min | Light curve from ZTF DR8 folded with the best period | minkovskiy15-ztf-phased.png | minkovskiy15-brir.png | ZTF18ablnbgx | |
| 46 | Minkovskiy 16 | 2MASS J19534454+3838432, GSC2.3 N2FQ131991, USNO-B1.0 1286-0369685 | 19 53 44.55 +38 38 43.4 | EA | 17.5 | 18.8 r | r | 5.1837 d | 08 Oct 2019 (HJD 2458764.707) | min | Light curve from ATLAS and ZTF DR8 folded with the best period | minkovskiy16-lc.png | minkovskiy16-brir.png | ||
| 47 | Minkovskiy 17 | USNO-B1.0 1252-0417511 | 20 40 16.47 +35 12 45.6 | EA | 17.1 | 18.7 r | r | 6.2529 d | 15 May 2020 (HJD 2458985.104) | min | Light curve from ATLAS and ZTF (and Pan-STARRS1?) folded with the best period | minkovskiy17-lc.png | minkovskiy17-brir-ps1gri.png | ||
| 48 | Shustov 1 | 2MASS J20524358+4939259, GSC2.3 N30U027050, USNO-B1.0 1396-0373005 | 20 52 43.59 +49 39 26.1 | SR | 16.9 | 17.8 r | r | 79.3 d | 18 Jun 2018 (HJD 2458288.0) | max | P2=635 d, Epoch2=2458340. Light curve from ATLAS and ZTF data folded with two pulsation periods. Long term light curve from ATLAS and ZTF data | shustov1-atlas-ztf-phased_lc.png shustov1-atlas-ztf-lc.png | shustov1-brir.jpg | ||
| 49 | KazakevichOA 2 | GSC2.3 N1XM073452, ZTF19abiwnte | 19 57 29.77 +10 22 20.2 | UG | 19.2 | 23: r | r | Outburst on 1990-07-27 POSS-II Blue plate. Maximum magnitude from ZTF (Lasair) data. Approximate minimum magnitude from Pan-STARRS1 images. | -- | kazakevichoa2-brir5x5.jpg | ZTF19abiwnte | ||||
| 50 | Minkovskiy 18 | 2MASS J20435282+3208022, GSC2.3 N34O008205, USNO-B1.0 1221-0585747 | 20 43 52.87 +32 08 02.6 | EA | 18.2 | 20.7: g | g | 2.993 d | 15 May 2019 (HJD 2458618.64) | min | Light curve from ZTF folded with the best period | minkovskiy18-ztf-phased-lc.png | minkovskiy18-brir.png | ||
| 51 | Minkovskiy 19 | 2MASS J19435233+1421335, GSC2.3 N1UL022715, USNO-B1.0 1043-0516571 | 19 43 52.35 +14 21 33.6 | EA | 18.1 | 20.3 g | g | 2.087 d | 12 Aug 2018 (HJD 2458343.29) | min | Light curve from ZTF folded with the best period | minkovskiy19-ztf-lc.png | minkovskiy19-brir.png | ||
| 52 | KazakevichOA 3 | GSC2.3 N1WD049517 | 20 01 44.96 +00 46 59.1 | UG | 16.6 B | 23: g | B/g | Outburst on 1982-08-16 SERC-J plate. Maximum magnitude from GSC 2.3. Approximate minimum magnitude from Pan-STARRS1. | -- | kazakevichoa3-jr6x6.jpg | |||||
| 53 | DAV V4 | GSC2.3 S022017033 | 00 06 20.22 -17 38 42.7 | UG | 17.8 B | <23 g | B/g | Outburst on 1977-11-04 DSS blue plate. Maximum magnitude from GSC2.3 Minimum magnitude from Pan-STARRS1 images. | -- | davv4-jr6x6.jpg | |||||
| 54 | KazakevichOA 4 | GSC2.3 S9YD048516 | 19 57 44.32 -01 42 20.7 | UG | 15.5 B | 22.1 g | B/g | Outburst on 1982-08-16 SERC-J plate. Maximum magnitude from GSC 2.3. Minimum magnitude from Pan-STARRS1. | -- | kazakevichoa4-jr6x6.jpg | |||||
| 55 | Minkovskiy 20 | GSC2.3 N2IX118496, USNO-B1.0 1299-0358589 | 19 50 10.14 +39 57 51.2 | EA | 19.6 | 21.5: g | g | 2.251327 d | 20 Nov 2020 (HJD 2459174.27) | min | Light curve from ZTF folded with the best period | minkovskiy20-ztf-lc.png | minkovskiy20-brir.png | ||
| 56 | Gusev 1 | 2MASS J21383674+4855010, GSC2.3 N2UZ130652, USNO-B1.0 1389-0412934 | 21 38 36.74 +48 55 01.1 | M | 16.3 | 18.4 r | r | 445 d | 10 May 2018 (HJD 2458249) | max | C: | Light curve from ZTF data. Light curve folded with the best pulsation period | gusev1-ztf-phased-lc.png gusev1-ztf-lc.png | gusev1-brir.jpg | |
| 57 | Lisniak 2 | 2MASS J17443645+1316141, GSC2.3 N38Q018052, USNO-B1.0 1032-0307675 | 17 44 36.45 +13 16 13.9 | NL | 17.4 | 17.6 r | r | FUV-NUV=-0.54 (GALEX DR5). M_abs=+5.5 (Gaia EDR3). Light curve from ZTF DR9 and ATLAS data | lisniak2-atlas-lc.png lisniak2-ztf-lc.png | lisniak2-brir.jpg | |||||
| 58 | Minkovskiy 21 | 2MASS J18421898+1253090, GSC2.3 N28G148621, USNO-B1.0 1028-0439526 | 18 42 18.99 +12 53 09.2 | EA | 17.06 | 19.4: r | r | 3.2214 d | 31 Mar 2020 (HJD 2458939.76) | min | Light curve from ZTF folded with the best period | minkovskiy21-ztf-phased-lc.png | minkovskiy21-brir.png | ||
| 59 | DAV V5 | GSC2.3 S5IO016680 | 10 47 38.47 -17 21 36.9 | UG | 19.4 B | <23 g | B/g | Outburst on 1984-01-30 POSS-II blue plate. Maximum magnitude from GSC 2.3. Minimum magnitude from PanSTARRS-1 images. | -- | davv5-jr.jpg | |||||
| 60 | Lisniak 3 | USNO-B1.0 0758-0677744, Gaia22beg | 19 36 37.53 -14 08 30.4 | UG | 16.4 B | 23.7 g | B/g | Outburst on 1980-07-12 Blue DSS plate. Minimum magnitude from Pan-STARRS1, maximum magnitude from USNO-B1.0. | -- | lisniak3-jr6x6.jpg | |||||
| 61 | Gusev 3 | 2MASS J21224796+4935165, GSC2.3 N2TJ075654, USNO-B1.0 1395-0396745 | 21 22 47.96 +49 35 16.5 | M | 15.2 Rc | 19.9 r | Rc/g | J-K=3.1 (2MASS). Maximum magnitude from USNO-B1.0, minimum from ZTF data. Light curve from ZTF DR10 | gusev3-ztf-lc.png | gusev3-brir5x5.jpg | |||||
| 62 | DAV V6 | 2MASS J17120525-2441429, GSC2.3 S8CW005608, USNO-B1.0 0653-0428495 | 17 12 05.25 -24 41 42.8 | SR | 15.2 | 15.7 r | r | 127 d | 09 Apr 2019 (HJD 2458583) | max | P2=112, Epoch2=2458572. Light curve from ZTF data folded with the best and the second pulsation periods | davv6-ztf-phased-lc.png davv6-ztf-secondary-phased-lc.png | davv6-rir.jpg | ||
| 63 | Baraldi 1 | 2MASS J06063044+3455254, GSC2.3 N8B7013479, USNO-B1.0 1249-0121036 | 06 06 30.45 +34 55 25.4 | UV | 17.5 | 20.1 B | B | M4.5 | Flare on 1997-03-10 POSS-II Blue plate. Range from USNO-B1.0. Spectral type from 2016MNRAS.457.2192C | -- | baraldi1-brir.jpg baraldi1-o-b.jpg | ||||
| 64 | BhaNaViRa 1 | PSO J194629.686+115207.601, ZTF18acwrtad | 19 46 29.68 +11 52 07.4 | UG | 17.8 | 23: r | r | Outburst on 1990-08-13 POSS-II Blue plate. Maximum magnitude from ZTF (ALeRCE) data. Approximate minimum magnitude from Pan-STARRS1 images. | -- | bhanavira1-brir5x5.jpg | |||||
| 65 | DAV V7 | 2MASS J19570232+3034423, GSC2.3 N32G191666 | 19 57 02.33 +30 34 42.4 | M | 14.8 | <18.0 i | i | 328 d | 15 Aug 2020 (HJD 2459077) | max | Light curve from ZTF DR10 folded with the best pulsation period | davv7-phased-lc-vsx.png davv7-ztf-lc.png | davv7-brir5x5.jpg | ||
| 66 | Minkovskiy 22 | GSC2.3 SA5J062679, ZTF19abraaje | 19 30 13.33 -08 07 53.7 | NL+E: | 19.3 | 21.7 r | r | Minimum magnitude from Pan-STARRS1. Zoomed light curve showing an eclipse on MJD= 58731.196 - 58731.216. Zoomed light curve showing an eclipse on MJD= 58730.165 - 58730.22 | minkovskiy22-ztf-lc.png minkovskiy22-ztf-lc2.png minkovskiy22-ztf-lc3.png | minkovskiy22-brir-5x5.png | ZTF19abraaje | ||||
| 67 | BhaNaViRa 2 | 2MASS J20363987+3539141, USNO-B1.0 1256-0417004 | 20 36 39.87 +35 39 14.0 | SR | 15.8 | 17.2 r | r | 912 d | 07 Jun 2022 (HJD 2459738) | min | Elements in the table are for the minima of the Long Secondary Period (LSP). Also pulsations with P= 112 d. Minimum magnitude from SDSS. Light curve from ZTF DR10 in g and r filters folded with the long pulsation period | bhanavira2-phased-lc.png bhanavira2-ztf-lc.png | bhanavira2-brir.jpg | ||
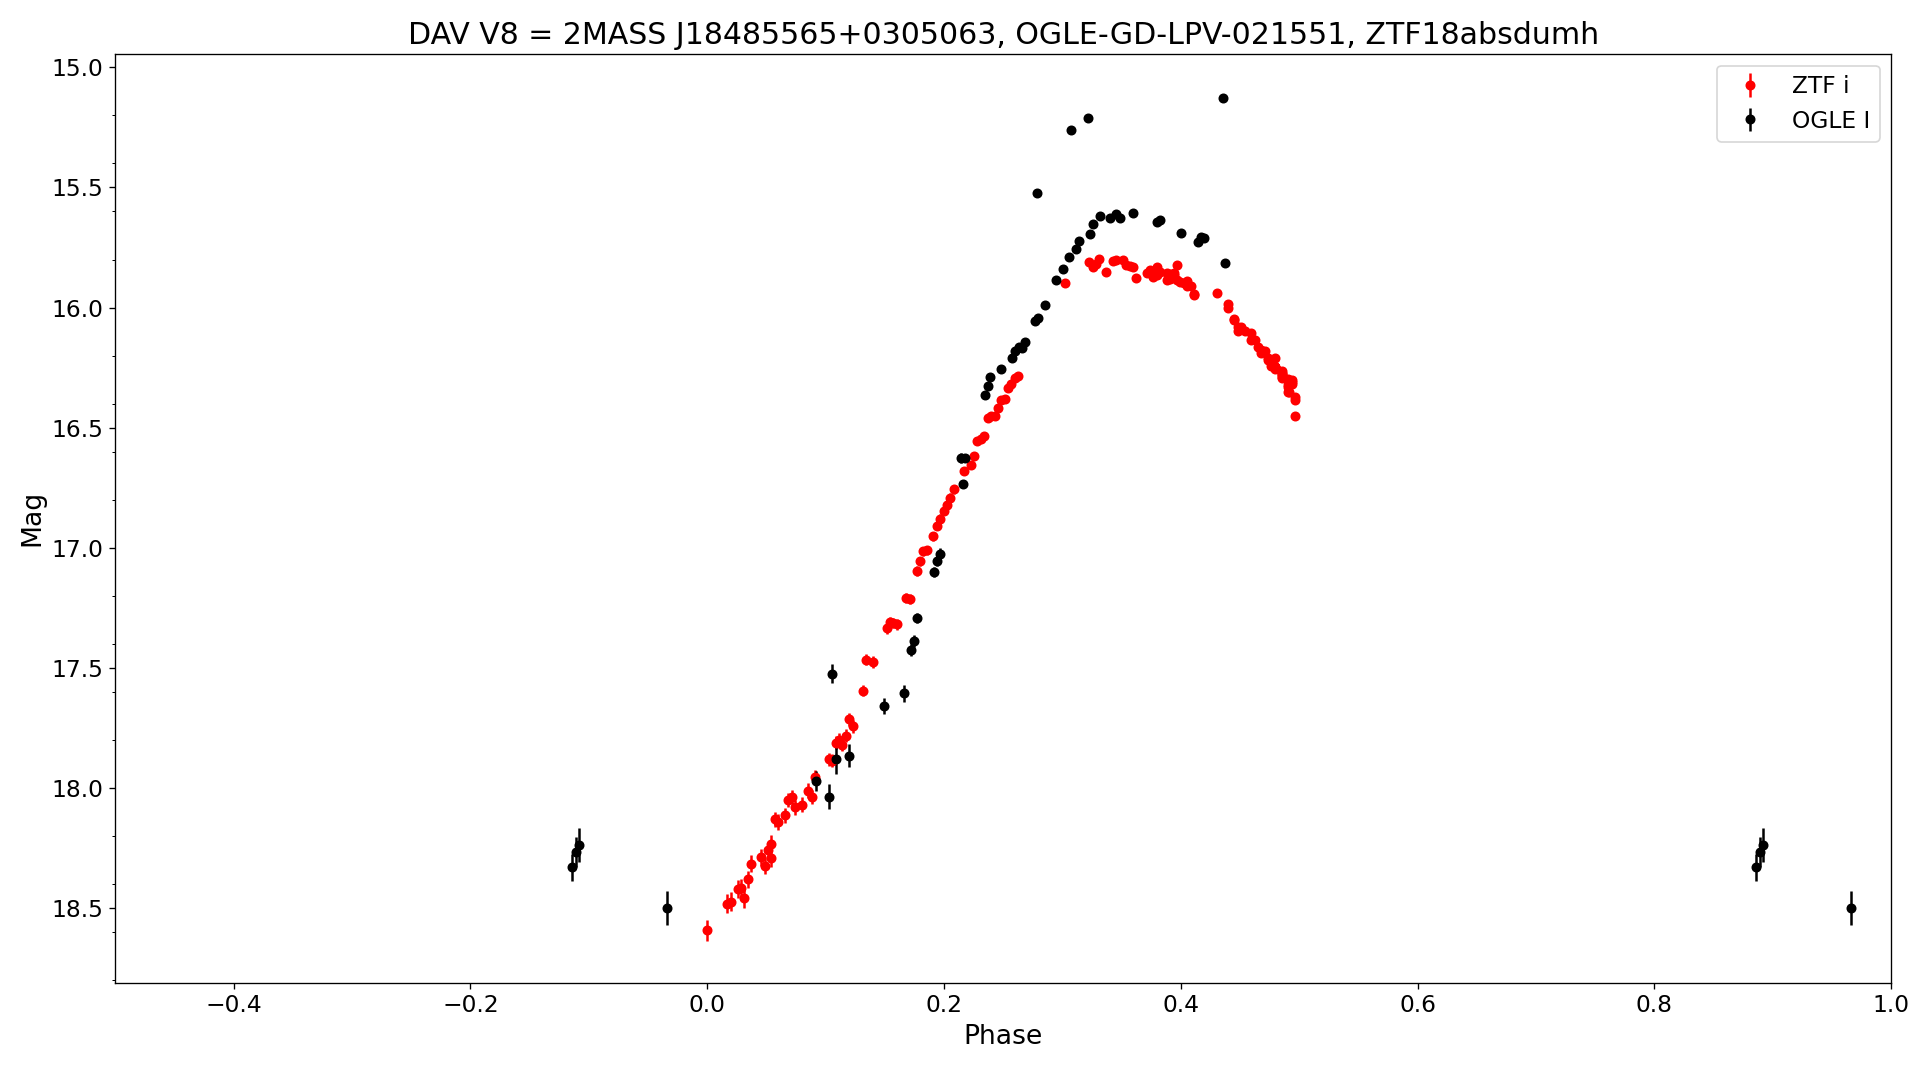
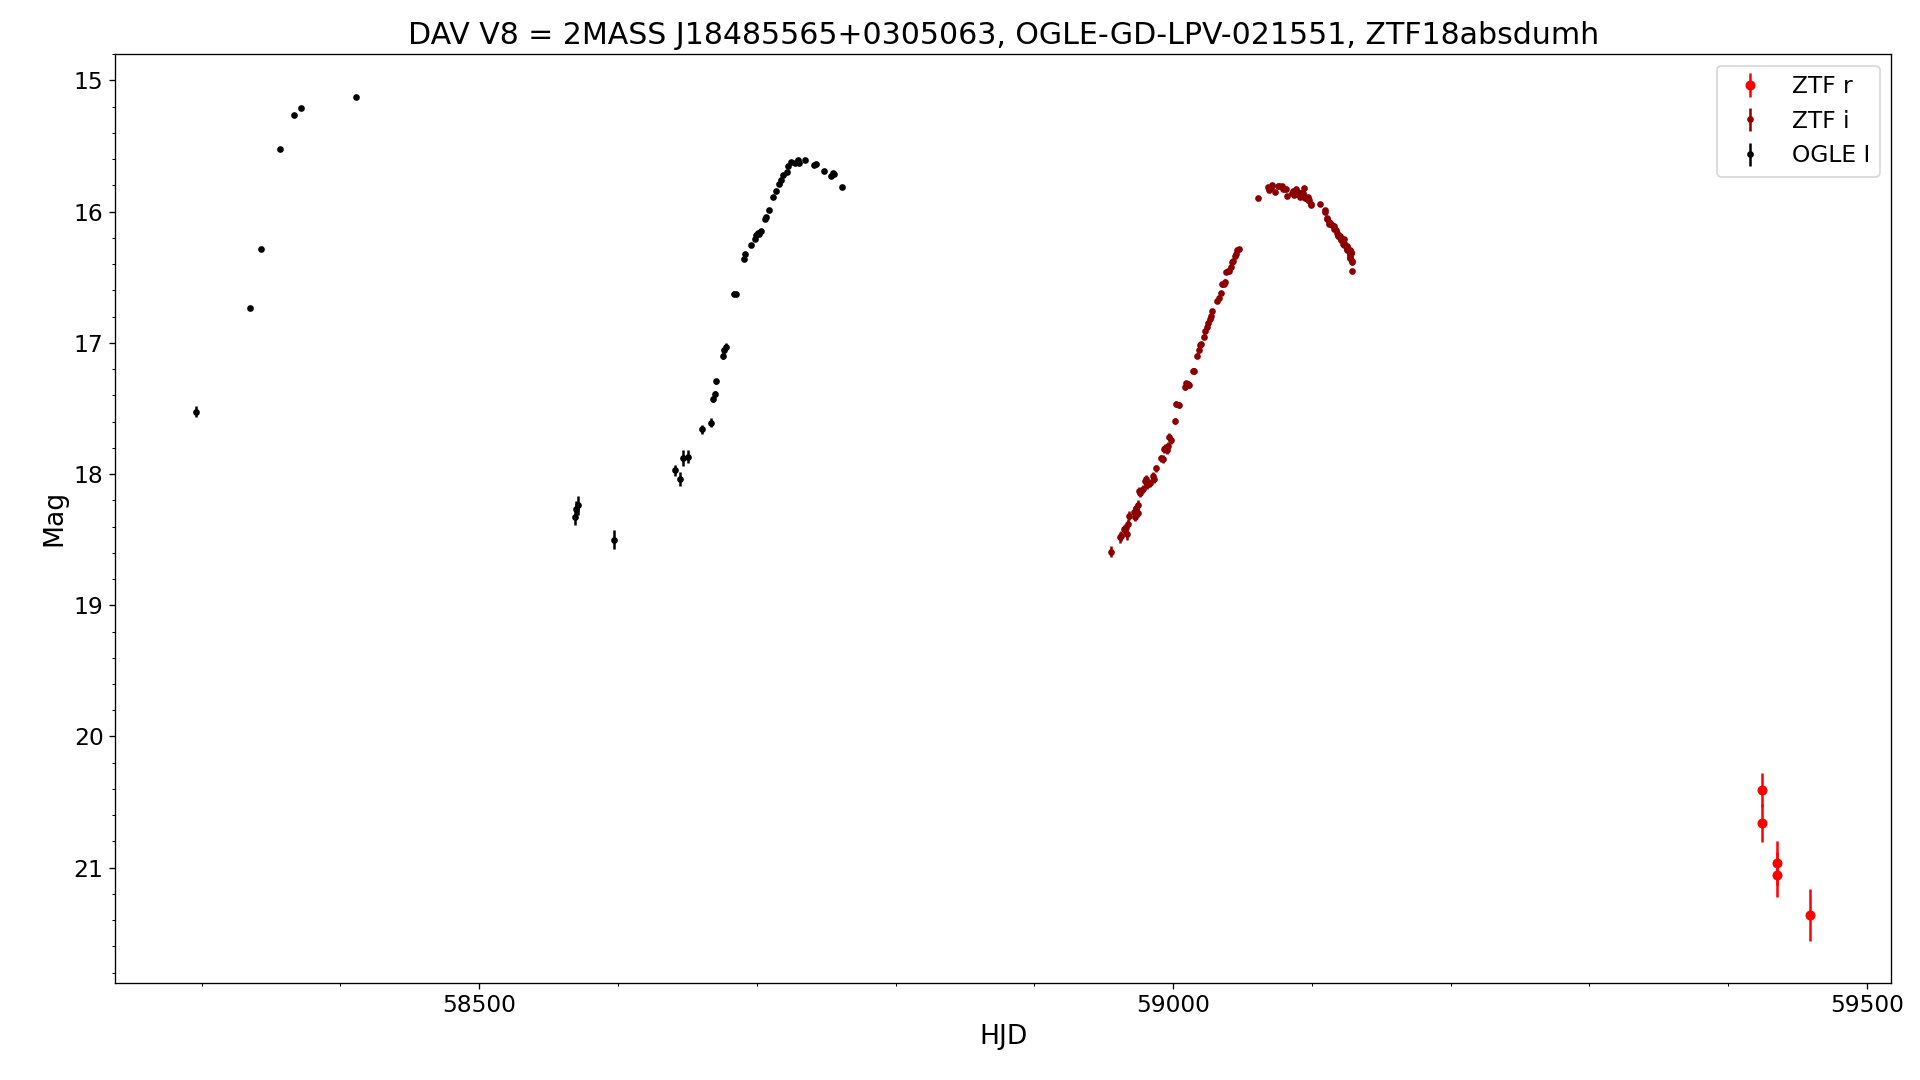
| 68 | DAV V8 | 2MASS J18485565+0305063, GSC2.3 N1NT030045, ZTF18absdumh | 18 48 55.66 +03 05 06.3 | M | 15.7 | <18.5 i | i | 349.65 d | 16 Apr 2020 (HJD 2458955.98715) | min | OGLE data: 2022ApJS..260...46I. Light curve from ZTF r and i filters folded with the best pulsation period. | davv8-ztf-ogle-phased-lc.png davv8-ztf-ogle-lc.png davv8-phased-lc.png davv8-ztf-lc.png ogle-gd-lpv-021551.png | davv8-jrir6x6.jpg | davv8-ztf-i.dat davv8-ztf-r.dat ogle-gd-lpv-021551.dat davv8-ogle-ztf-i.dat | |
| 69 | DAV V9 | 2MASS J18290234-0825394, OGLE-GD-LPV-018228, GSC2.3 S9OF074518 | 18 29 02.35 -08 25 39.5 | M | 16.1 | <18.9 i | i | 359.5 d | 25 Aug 2020 (HJD 2459087.0) | max | Period from 2022ApJS..260...46I Minimum magnitude from Pan-STARRS1. Light curve from ZTF DR10 in r and i filters folded with the best pulsation period. | davv9-phased-lc.png davv9-ztf-lc.png | davv9-jrir6x6.jpg | ||
| 70 | DAV V10 | 2MASS J18493478+0323473, GSC2.3 N1NV035122 | 18 49 34.79 +03 23 47.2 | M | >16.1 | 18.5 i | i | Maximum magnitude from IPHAS DR2. Light curve from ZTF DR10 in i filter | davv10-ztf-lc.png | davv10-brir.jpg | |||||
| 71 | Minkovskiy 23 | 2MASS J19431861+3310081, GSC2.3 N2GV043397, USNO-B1.0 1231-0433523 | 19 43 18.63 +33 10 08.0 | EA | 17.52 | 19.9 g | g | 2.7129 d | 11 Aug 2018 (HJD 2458342.4) | min | Light curve from ZTF folded with the best period | minkovskiy23-ztf-lc.png | minkovskiy23-brir-10x10.png | ||
| 72 | Lisniak 4 | GSC2.3 S9NX025553 | 18 14 29.38 -08 38 15.0 | UG | 16.7 B | 23: g | B/g | Maximum magnitude from GSC2.3. Approximate minimum magnitude from Pan-STARRS1 images. | -- | lisniak4-dss-ps.jpg A comparison of two images showing the object bright (DSS plate) and faint (PS1 z-zg-g image). | |||||
| 73 | DAV V11 | 2MASS J18505837+0153276, GSC2.3 N1NZ028223 | 18 50 58.38 +01 53 27.6 | M | 17.5: | 20.7: i | i | 371.747 | 20 Jul 2021 (HJD 2459416.4642) | min | Light curve from ZTF data | davv11-ztf-lc.png | davv11.png | davv11-ztf-i.dat davv11-atlas.txt | |
| 74 | BhaNaViRa 3 | 2MASS J10155540-0540052, GSC2.3 S52U003612, USNO-B1.0 0843-0209006 | 10 15 55.40 -05 40 05.1 | UV | 17.6 R | 20.2 G | R/G | Flare on 1986-03-31 POSS-II Red plate. Maximum magnitude from USNO-B1.0. Minimum magnitude from Gaia DR3. | -- | bhanavira3-brir6x6.jpg | |||||
| 75 | Gusev 4 | 2MASS J21224020+4935392, GSC2.3 N2TJ035177, USNO-B1.0 1395-0396648 | 21 22 40.21 +49 35 39.2 | EA | 17.3 | <21.0 r | r | 2.0475 d | 15 Oct 2019 (HJD 2458772.32) | min | Light curve from ZTF DR10 folded with the best orbital period | gusev4-ztf-phased-lc.png gusev4-ztf-lc.png | gusev4-brir5x5.jpg | ||
| 76 | BhaNaViRa 5 | GSC2.3 N347071005, USNO-B1.0 1255-0420410 | 20 37 46.47 +35 30 12.3 | UG|YSO: | 19.3 B | 22.3 g | B/g | Brighter on 1989-06-30 POSS-II blue plate. Maximum magnitude from GSC2.2. Minimum magnitude from Pan-STARRS1. | -- | bhanavira5.png | |||||
| 77 | Arinkin 1 | 2MASS J03032084+6029284, USNO-B1.0 1504-0102509 | 03 03 20.83 +60 29 28.4 | YSO | 16.9 | 17.4 r | r | B7.0 | Minimum magnitude from IPHAS DR2. Spectral type from 2011ApJ...726...18K. Light curve from ZTF DR13 | arinkin1-ztf-lc.png | arinkin1-brir.jpg | ||||
| 78 | DAV V12 | Gaia DR3 4095182738993295104 | 18 02 59.78 -19 58 45.5 | L | 17.6 | 18.4 i | i | Uncertain identiification. 0.8" pair of red stars. The NW component, brighter (G= 19.2) in Gaia DR3, has been chosen as the variable. The other star is 2MASS J18025980-1958459 (G= 19.5). Combined range given. Minimum magnitude from Pan-STARRS1. | davv12-ztf-lc.png | davv12-rir5x5.jpg | |||||
| 79 | BhaNaViRa 6 | GSC2.3 NAPK018208 | 05 56 14.92 +50 31 55.0 | SN|UG | 18.1 R | <23 r | R/r | Outburst on 1989-12-04 POSS-II Red plate. 24'' NE from the center of the galaxy 2MASX J05561281+5031408. Maximum magnitude from GSC2.3. Minimum magnitude from Pan-STARRS1 images. | -- | bhanavira6-brir.jpg | |||||
| 80 | DAV V13 | 2MASS J18281545-1318372, GSC2.3 S9JW101828 | 18 28 15.45 -13 18 37.2 | L | 17.4 | 17.6 i | i | Light curve from ZTF DR13 in i filter | davv13-ztf-lc.png | davv13-rir5x5.jpg | |||||
| 81 | BhaNaViRa 4 | GSC2.3 N3QT005599 | 16 01 30.44 +08 01 09.0 | UG: | 17.9 R | <24 r | R/r | Outburst on 1989-04-08 POSS-II Red plate. Maximum magnitude from GSC2.3. Approximate minimum magnitude from DECaLS images. | -- | bhanavira4.png | |||||
| 82 | BhaNaViRa 7 | Gaia DR3 2025469403899718016 | 19 36 22.41 +28 15 29.0 | UG | 17.2 CR | 20.4 r | CR/r | Approximate maximum magnitude from 1995-08-03 POSS-II red plate. Minimum magnitude derived from IPHAS DR2 | -- | bhanavira7.png | |||||
| 83 | DAV V14 | 2MASS J19120236+0834324, GSC2.3 N2BI137237 | 19 12 02.36 +08 34 32.4 | L | 18.6 | 19.6: i | i | Minimum magnitude from PanSTARRS-1. Light curve from ZTF DR13 in i filter | davv14-ztf-lc.png | davv14.png | |||||
| 84 | Vizgin 1 | 2MASS J18245594-1014389 | 18 24 55.94 -10 14 39.0 | YSO: | 18.7 | 20.1: i | i | Light curve from ZTF DR13 | vizgin1-ztf-lc.png | vizgin1-brir5x5.jpg | |||||
| 85 | BhaNaViRa 8 Gaia DR3 2056607023408105216 | 2MASS J20351475+3513598 GSC2.3 N346015798 USNO-B1.0 1252-0411211 | 20 35 14.76 +35 13 59.7 | SRB | 14.0 | 14.7 r | r | 68 d | 20 Jun 2019 (HJD 2458655) | max | Other period 82 days. Minimum magnitude from Pan-STARRS1. Light curve from ZTF DR13 in r filter folded with the best period | bhanavira8-ztf-phased-lc.png bhanavira8-ztf-lc.png | bhanavira8-brir.jpg | ||
| 86 | BhaNaViRa 9 | Gaia DR3 2045447083480954368 | 19 38 32.77 +32 58 11.0 | UG | 17.4 B | 21.6 g | B/g | Approximate maximum magnitude from 1988-06-12 Blue DSS plate. Minimum magnitude from Pan-STARRS1 g image. | -- | bhanavira9-brir5x5.jpg | |||||
| 87 | BhaNaViRa 10 | 2MASS J06343849+0413088, GSC2.3 N833014001 | 06 34 38.49 +04 13 08.9 | YSO | 19.4 | 20.7 r | r | Light curve from ZTF data | bhanavira10-ztf-lc.png | bhanavira10.png | |||||
| 88 | DAV V15 | 2MASS J17573051-1847430, USNO-B1.0 0712-0518730 | 17 57 30.52 -18 47 43.1 | L | 18.0 | 19.9 i | i | Minimum magnitude from PanSTARRS-1. Maximum magnitude from ATLAS-REFCAT2. Light curve from ZTF DR13 in i filter | davv15-ztf-lc.png | davv15.png (плохое качество!) | |||||
| 89 | BhaNaViRa 11 | 2MASS J18123068-1746159, GSC2.3 S9J9039713 | 18 12 30.68 -17 46 15.8 | L | 16.8 | 17.0 i | i | M | Spectral type from Gaia DR3. Light curve from ZTF DR13 in i filter | bhanavira11-ztf-lc.png | bhanavira11.png | ||||
| 90 | BhaNaViRa 12 | GSC2.3 S9M8097647 | 18 51 14.76 -05 09 24.0 | UG: | 17.0 B | 23.8 r | B/r | Minimum magnitude from Pan-STARRS1. Maximum magnitude from GSC2.3. | -- | bhanavira12-ug.png | |||||
| 91 | Vizgin 2 | 2MASS J19443022+2334510 | 19 44 30.21 +23 34 50.8 | YSO | 19.6 | 21.3 r | r | Light curve from ZTF DR13 in r and i filters | vizgin2-ztf-lc.png | vizgin2-brir5x5.jpg | |||||
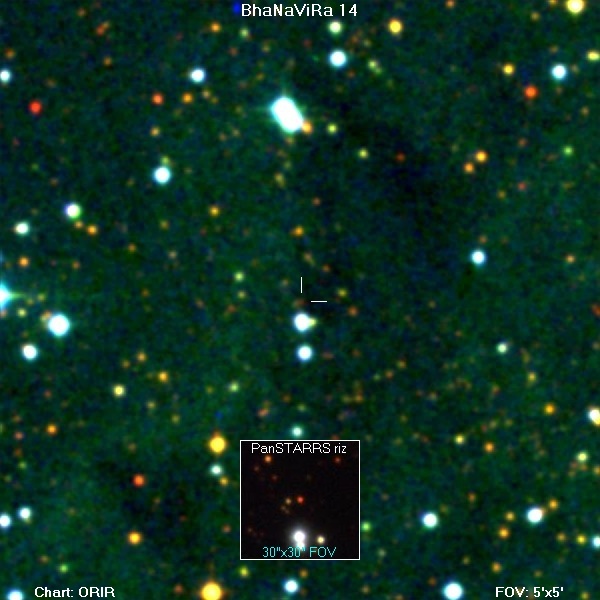
| 92 | BhaNaViRa 14 | 2MASS J18055611-2135008 | 18 05 56.12 -21 35 00.8 | YSO | 18.6 | 19.8 i | i | Light curve from ZTF DR13 in i filter | bhanavira14-ztf-lc.png | bhanavira14-orir5x5.jpg | |||||
| 93 | Vizgin 3 | 2MASS J18281469-0341187, GSC2.3 S9IJ024629 | 18 28 14.70 -03 41 18.6 | L | 18.5 | 18.7 i | i | Light curve from ZTF DR13 | vizgin3-ztf-lc.png | vizgin3-brir.jpg | |||||
| 94 | BhaNaViRa 15 | 2MASS J18275006-1315554 | 18 27 50.06 -13 15 55.3 | YSO | 17.5 | 18.6 i | i | Light curve from ZTF DR13 in i filter | bhanavira15-ztf-lc.png | bhanavira15-orir5x5.jpg | |||||
| 95 | BhaNaViRa 16 | GSC2.3 N5Z4013338, USNO-B1.0 1443-0239042 | 15 03 04.78 +54 22 30.2 | UV+BY | 16.6 | 17.6 g | g | M4V | Spectral type from 2016MNRAS.457.2192C. Light curve from ZTF DR13 in g filter | bhanavira16-ztf-lc.png | bhanavira16-brir.jpg | ZTF18aaqmvjx | |||
| 96 | BhaNaViRa 17 | GSC2.3 N2FJ086391 | 19 40 08.77 +28 58 03.9 | UG: | 17.4 R | <23 r | R/r | Maximum magnitude from GSC2.3. Minimum magnitude from Pan-STARRS1 images. | -- | bhanavira17-brir5x5.jpg | |||||
| 97 | ShatalovaJ 1 | 2MASS J15552271+2645028, GSC2.3 N64V003636, USNO-B1.0 1167-0266312 | 15 55 22.64 +26 45 02.7 | UV | 19.3 B | 21.9 g | B/g | M5.0V | Flare on 1990-05-17 Blue DSS plate. Spectral type from 2016MNRAS.457.2192C. Maximum magnitude estimated from the POSS-II Blue plate, minimum magnitude from SDSS DR16. | -- | shatalovaj1-brir.jpg shatalovaj1-poss-blue.jpg Comparison of Blue DSS plates from 1990-05-17 (flare) and 1950-05-18 (quiescence) | ||||
| 98 | Lisniak 5 | GSC2.3 N5CO011100 | 13 16 11.48 +23 17 17.4 | UG | 17.5 B | <23 g | B/g | Maximum magnitude from GSC 2.3. Minimum magnitude from Pan-STARRS1 images. | -- | lisniak5-brir.jpg | |||||
| 99 | BhaNaViRa 13 | GSC2.3 SA5J054623 | 19 30 54.39 -08 24 23.4 | VAR | 18.1 B | 24.3 g | B/g | Outburst on 1983-07-14 DSS blue plate. Uncertain identification. Object looks too red for a dwarf nova and is 1" to the WSW of the GSC2.3 position. Maximum magnitude from GSC2.3. Minimum magnitude from Pan-STARRS1 data. | -- | bhanavira13.jpg | |||||
| 100 | BhaNaViRa 18 | 2MASS J14201486+5722219, GSC2.3 N48Q003240, USNO-B1.0 1473-0291502 | 14 20 14.87 +57 22 21.9 | UV | 15.8 | 18.6 g | g | M4V | Spectral type from 2016MNRAS.457.2192C. Light curve from ZTF DR14 in g and r filters | bhanavira18-ztf-lc.png | bhanavira18-ztf.png Comparison of ZTF-20180419322650 (flare) and ZTF-20180419349479 (quiescence) plates. | ||||
| 101 | BhaNaViRa 19 | GSC2.2 N023330362558 | 19 10 14.68 +17 05 15.3 | UG: | 18.9 B | 22: g | B/g | The object's magnitude in GSC2.2 is the same as the GSC2.3 magnitude (18.86) for GSC2.3 N2CZ062558, which is 1.0" to the E. Maximum magnitude from GSC2.2. Approximate minimum magnitude from Pan-STARRS1 g image. | -- | bhanavira19-dss-br.png bhanavira19-ps1-g.jpg | |||||
| 102 | DAV V16 | GSC2.3 S04L006770 | 00 57 58.42 -06 23 24.2 | SN: | 18.5 B | <24.5: r | B/r | Outburst on 1982-11-19 DSS blue plate. DES J005758.40-062323.8, classified as a galaxy, is 0.4" away from the GSC2.3 position. Maximum magnitude from GSC2.3. Minimum magnitude from DES. | -- | davv16.png | |||||
| 103 | BhaNaViRa 20 | GSC2.2 S222232093763 | 16 37 29.31 -28 41 41.6 | UG: | 18.4 B | <23 g | B/g | Maximum magnitude from GSC2.2. Minimum magnitude from Pan-STARRS1 images. | -- | bhanavira20-ps-dss.png | |||||
| 104 | BhaNaViRa 21 | 2MASS J18274991-1315522, GSC2.3 S9JW102186, USNO-B1.0 0767-0506859 | 18 27 49.91 -13 15 52.2 | YSO | 18.0 | 19.0 r | r | Light curve from ZTF DR13 in r filter | bhanavira21-ztf-lc.png | bhanavira21-orir.jpg | |||||
| 105 | BhaNaViRa 22 | 2MASS J18041531-2101328, GSC2.3 S9J7045923 | 18 04 15.31 -21 01 32.9 | SR | 15.8 | 16.0 i | i | 41 d | 28 May 2020 (HJD 2458998) | max | Light curve from ZTF DR13 in i filter folded with the best pulsation period | bhanavira22-ztf-phased-lc.png bhanavira22-ztf-lc.png | bhanavira22-orir5x5.jpg | ||
| 106 | DAV V17 | GSC2.3 SBLR009288 | 22 44 47.48 -28 07 22.2 | UG: | 16.2 B | <23 g | B/g | Outburst on 1980-09-30 DSS blue plate. Maximum magnitude from GSC2.3. | -- | davv17.png | |||||
| 107 | DAV V18 | GSC2.3 S34J013410 | 02 59 10.89 -27 32 35.5 | SN: | 18.4 B | <23 g | B/g | Outburst on 1977-12-12 DSS blue plate. Maximum magnitude from GSC2.3. Minimum magnitude from Pan-STARRS1 images. | -- | davv18.png | |||||
| 108 | BhaNaViRa 25 | 2MASS J18074942-2155576, GSC2.3 SA6B009713, USNO-B1.0 0680-0649365 | 18 07 49.43 -21 55 57.7 | SR | 15.8 | 16.1 r | r | 32.6 d | 03 Aug 2019 (HJD 2458698.6) | max | Light curve from ZTF DR15 folded with the best pulsation period | bhanavira25-ztf-phased-lc.png | bhanavira25-orir.jpg | ||
| 109 | BhaNaViRa 23 | 2MASS J18032071-2052521, GSC2.3 S9J7010983, USNO-B1.0 0691-0572722 | 18 03 20.72 -20 52 52.3 | L | 16.88 | 16.97 r | r | Light curve from ZTF DR15 in r filter | bhanavira23-ztf-lc.png | bhanavira23-br.png | |||||
| 110 | BhaNaViRa 24 | 2MASS J18034395-2036518, GSC2.3 S9J7046833 | 18 03 43.96 -20 36 51.9 | L | 15.6 | 15.9 i | i | Light curve from ZTF DR15 in i filter | bhanavira24-ztf-lc.png | bhanavira24-ps-dss.png | |||||
| 111 | BhaNaViRa 26 | 2MASS J18024763-2015037, GSC2.3 S9J6044797 | 18 02 47.64 -20 15 03.7 | L | 15.0 | 15.2 i | i | Light curve from ZTF DR15 in i filter | bhanavira26-ztf-lc.png | bhanavira26.png | |||||
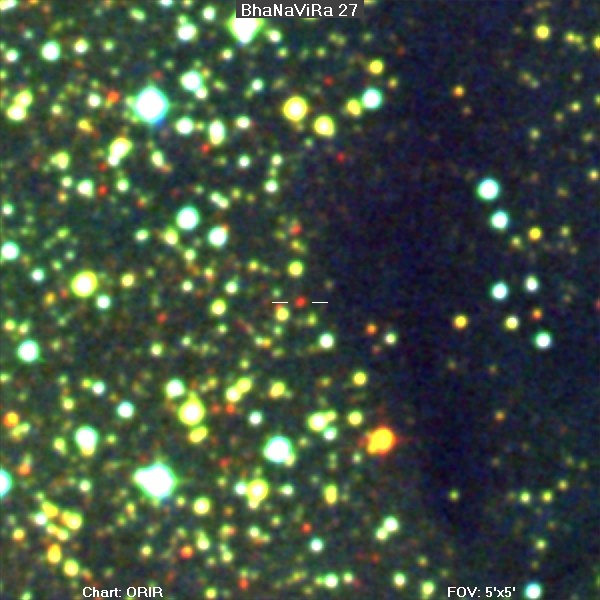
| 112 | BhaNaViRa 27 | 2MASS J18031038-2051508, GSC2.3 S9J7046306, USNO-B1.0 0691-0572377 | 18 03 10.38 -20 51 51.1 | L | 16.55 | 16.71 i | i | Light curve from ZTF DR15 in i filter | bhanavira27-ztf-lc.png | bhanavira27-orir.jpg | |||||
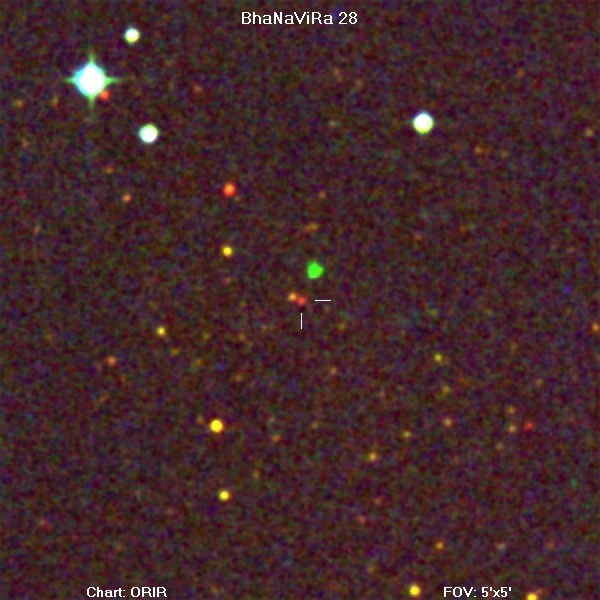
| 113 | BhaNaViRa 28 | 2MASS J18274029-0327053, GSC2.3 S9IJ024723 | 18 27 40.30 -03 27 05.5 | L | 17.20 | 17.46 i | i | Light curve from ZTF DR15 in i filter | bhanavira28-ztf-lc.png | bhanavira28-orir.jpg | |||||
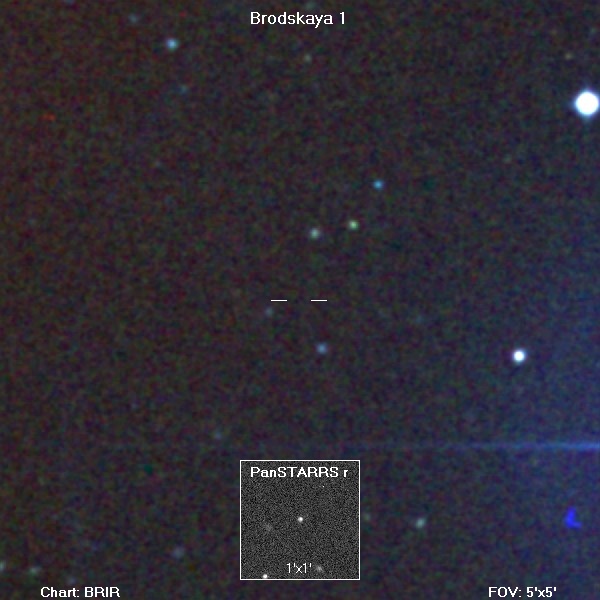
| 114 | Brodskaya 1 | PSO J114739.493+612535.053 | 11 47 39.49 +61 25 35.0 | UV | 18.7 | 24.3: r | r | Flare on PanSTARRS-1 red image on 2012 Mar. 28. Range and position from PanSTARRS-1. | -- | brodskaya1-brir.jpg | |||||
| 115 | DAV V19 | 2MASS J18281708-1332177, GSC2.3 S9JW099736 | 18 28 17.08 -13 32 17.8 | L | 18.1 | 19.2: i | i | Minimum magnitude from PanSTARRS-1. Light curve from ZTF DR16 in i filter | davv19-ztf-lc.png | davv19-orir6x6.jpg | |||||
| 1 | DDE 203 | 2MASS J19442324+0603253, USNO-B1.0 0960-0481213 | 19 44 23.26 +06 03 25.3 | EA | 16.76 | 20.2 g | g | 1.662489 d | 25 Jun 2019 (HJD 2458660.246) | min | Eclipses on 1993-06-16 POSS-II Red plate and on 1982-06-24 Quick-V plate. Light curve from ZTF data folded with the best orbital period | dde203-ztf-phased-lc.png | dde203-brir5x5.jpg | ||
| 2 | DDE 204 ZTF18abuclqi | GSC2.3 N1XW034389, AT 2019elf | 20 16 48.60 +06 01 36.7 | UG | 17.9 | 21.8 g | g | Outburst on 1988-07-08 POSS-II Blue plate. Light curve from ZTF data in r filter | dde204-ztf-lc.png | dde204-brir5x5.jpg | |||||
| 3 | DDE 205 | 2MASS J19255660+0609479, USNO-B1.0 0961-0438941 | 19 25 56.61 +06 09 47.9 | EA | 17.4 (16.7 r) | 20.3: g | g | 2.470008 d | 30 Mar 2018 (HJD 2458208.048) | min | Eclipse on 1992-08-01 POSS-II Red plate. Light curve from ZTF data folded with the best orbital period | dde205-ztf-phased-lc.png | dde205-brir5x5.jpg | ||
| 4 | DDE 206 | USNO-B1.0 0733-0096113 | 06 11 39.28 -16 37 47.3 | EA/HW | 18.2 | <20.0 g | g | 0.1124801 d (2.69952 h) | 13 Jan 2020 (HJD 2458861.892) | min | Reflection effect amplitude 0.25 mag. Light curve from ZTF data folded with the best orbital period | dde206-ztf-phased-lc.png | dde206-jrir.jpg | ||
| 5 | DDE 207 | 2MASS J19193618+0643468, USNO-B1.0 0967-0453894 | 19 19 36.19 +06 43 46.8 | EA | 17.2 | 18.9 g | g | 3.82714 d | 20 Nov 2020 (HJD 2459173.649) | min | Eclipse on 1992-08-01 POSS-II Red plate. Light curve from ZTF data folded with the best orbital period | dde207-ztf-phased-lc.gif | dde207-brir5x5.jpg | ||
| 6 | DDE 208 ATO J108.2755-08.7561 | 2MASS J07130613-0845218, USNO-B1.0 0812-0129928, Gaia22chq, ZTF17aaagrxo | 07 13 06.13 -08 45 22.0 | AM | 15.8 | 19.2 r | r | 0.0829019 d (119.3787 min) | 01 Nov 2017 (HJD 2458059.029) | min | Minimum epoch is given. Maxima at phases 0.25 and 0.83, Min II = 17.8 g at phase 0.37. Shape of the light curve is varying. Light curve from ATLAS (Oct. 2015 - May 2021) data and phase plots from ZTF r (January 2019) and ATLAS o (2018-2019 and 2020-2021) data. Minimum magnitude from ZTF (Lasair) data. Maximum magnitude derived from Gaia Alerts data. | dde208-1rxs-j0713-0845-ztf-atlas-phased-lc.png | dde208-jrir.jpg | ||
| 7 | DDE 209 | 2MASS J20573222-1804567, USNO-B1.0 0719-1057253 | 20 57 32.22 -18 04 56.9 | NL | 14.3 | 14.5 r | r | FUV-NUV=-0.47 (GALEX). M_abs=+5.5 (Gaia EDR3). Range from ATLAS data. Light curve from CSS, ZTF and ATLAS data | dde209-css-ztf-atlas-lc.png | dde209-jrir.jpg | |||||
| 8 | DDE 210 | GSC2.3 N2QK043588 | 20 48 33.58 +14 42 06.0 | UG | 15.9 R | 22.8 r | R/r | Outbursts on 1990-08-17 POSS-II Red and 1993-07-13 IR plates. Maximum magnitude from GSC2.3. Minimum magnitude and position from SDSS. | -- | dde210-brir.jpg | |||||
| 9 | DDE 211 | GSC2.3 N38M019705, USNO-B1.0 1046-0314806, Gaia22dek, ZTF18abrzeze | 17 57 24.21 +14 40 16.5 | UG | 17.5 | 20.5 g | g | Outburst on 1992-06-28 POSS-II Blue plate. Range from ZTF data. Light curve from ZTF DR5 | dde211-ztf-lc.png | dde211-br5x5.jpg | |||||
| 10 | DDE 212 | USNO-B1.0 1090-0273107 | 17 25 22.21 +19 00 49.1 | HADS | 18.4 | 18.8 c | c | 0.0563777 d (81.1839 min) | 22 May 2020 (HJD 2458992.151) | max | Light curve from ATLAS data in c and o filters folded with the best pulsation period | dde212-atlas-phased-lc.png | dde212-gri5x5.jpg | ||
| 11 | DDE 213 | GSC2.3 N2DB119281 | 19 07 08.08 +15 40 33.0 | UG | 18.2 | 21.1 g | g | Outburst on 1990-06-22 POSS-II Blue plate. Range from ZTF data. Light curve from ZTF DR5 | dde213-ztf-lc.png | dde213-brir5x5.jpg | |||||
| 12 | DDE 214 | GSC2.3 N2OU071459 | 20 29 32.88 +15 46 31.6 | UG | 18.2 | 23.5: r | r | Outburst on 1990-06-22 POSS-II Blue plate. Maximum magnitude from ZTF (Lasair) observations, minimum magnitude from PanSTARRS-1. | -- | dde214-brir5x5.jpg | |||||
| 13 | DDE 215 | 2MASS J18350035+1427311, USNO-B1.0 1044-0360583 | 18 35 00.36 +14 27 31.2 | EA | 17.0 | 18.7 g | g | 1.324065 d | 13 Nov 2020 (HJD 2459167.119) | min | Eclipses on 1990-06-21 and 1990-06-25 POSS-II Blue plates. Period and range from ZTF DR5. Light curve from ZTF data folded with the best orbital period | dde215-ztf-phased-lc.png | dde215-brir5x5.jpg |
| # | Name | Other | Coord (J2000) | Type | Max | Min | System | Period | Epoch (JD) | type | Sp | Comment | L.Curve | Find.Chart | Data |
|---|---|---|---|---|---|---|---|---|---|---|---|---|---|---|---|
| 1 | Karachurin 12 | 2MASS J17271078+6145278 USNO-B1.0 1517-0246427 | 17 27 10.80 +61 45 27.8 | UGZ | 13.8 | 14.9 V | V | B2 | ZTF18aakvuwy | find.chart | |||||
| 2 | Karachurin 14 | 2MASS J15114699-3456483 GSC2.3 S9H6047915 USNO-B1.0 0550-0344965 | 15 11 46.99 -34 56 48.4 | NL/VY: | 13.9 CV | 17.4 V | CV/V | Gaia DR2 parallax 1.2295 ± 0.1837 mas (distance 0.81 ± 0.13 kpc). | find.chart | ||||||
| 3 | Karachurin 15 | 2MASS J23164323+0116401 USNO-B1.0 0912-0566706 ZTF18abtxxag ZTF18abzyqas | 23 16 43.23 +01 16 40.2 | UGZ/IW+VY | 13.713.4 g | 18.9 g | g | ZTF18abzyqas, ZTF18abtxxag fc.jpg | find.chart | ||||||
| 4 | Karachurin 16 | 2MASS J12452340-3509562 GSC2.3 S6J5013792 USNO-B1.0 0548-0278718 | 12 45 23.43 23.41 -35 09 56.4 | UG | 15.6 | 18.7 CV | CV | Gaia DR2 parallax 0.60 ± 0.08 mas (distance 1.6 ± 0.2 kpc). | find.chart | ||||||
| 5 | Khrapov 1 | USNO-B1.0 1398-0068145 | 02 40 49.85 +49 51 54.9 | CV UG+VY: | 16.5 | 18.3 20.0 r | r | ZTF18aabezubGaia DR2 derived MV=+7.3. ZTF18aabezub | find.chart | ||||||
| 6 | Khrapov 2 | 2MASS J07202922+4916255 USNO-B1.0 1392-0185246 | 07 20 29.21 +49 16 25.7 | AM: | 16.3 | 19.0 CV | CV | Gaia parallax = 2.05+/-0.15 mas (distance = 487+/-36 pc). | find.chart | ||||||
| 7 | RSMR 1 | 2MASS J06365507+5557406 USNO-B1.0 1459-0176536 | 06 36 55.05 +55 57 40.7 | NL/VY | 17.4 17.1 | 18.5 21.0 g | g | ZTF18aabhjpnGaia parallax = 2.51+/-0.25 mas (distance = 398+/-40 pc). ZTF18aabhjpn | find.chart | ||||||
| 8 | MEM 1 | USNO-B1.0 1069-0144804 | 07 16 17.95 +16 59 35.2 | CV | 16.4 | 19.6 V | V | find.chart, animation | |||||||
| 9 | LANAT 1 | 2MASS J22114319+5214336 USNO-B1.0 1422-0490414 | 22 11 43.20 +52 14 33.7 | UGZ: | 15.5 | 18.4 g | g | em | LANAT1-BRIR.jpg Discovered during Moscow State University's LANAT summer camp. Standstill in ZTF data during MJD= 58217-58270. ZTF17aaawrkt | find.chart | |||||
| 10 | LANAT 2 | 2MASS J00145862+5941048 USNO-B1.0 1496-0007834 | 00 14 58.62 +59 41 04.7 | UG | 17.0 | 19.4 g | g | em | Discovered during Moscow State University's LANAT summer camp. ZTF17aaaedfi | find.chart | |||||
| 11 | Exuzyan 1 | USNO-B1.0 1297-0152866 | 05 38 50.21 +39 45 42.6 | UGSU | 17.3 | 20.8 g | g | em | Discovered during Moscow State University's LANAT summer camp. ZTF18aaaedcd | find.chartZTF18aaaedcd | |||||
| 12 | Exuzyan 2 | 2MASS J05101653+4021571 GSC2.3 NCA4018258 GSC2.3 NCA4067993 USNO-B1.0 1303-0118219 | 05 10 16.55 +40 21 57.1 | UG | 16.5 | 19.7 g | g | em | In outburst in GSC2.3 (Bjmag. 15.6). Discovered during Moscow State University's LANAT summer camp. ZTF17aabizrq | find.chart | |||||
| 13 | Exuzyan 3 | USNO-B1.0 1460-0448139 | 23 19 15.81 +56 02 01.7 | NL | 17.1 | 18.2 g | g | Discovered during Moscow State University's LANAT summer camp. ZTF18abblvfk | find.chart | ||||||
| 14 | Exuzyan 4 | USNO-B1.0 1269-0482362 | 20 43 35.40 +36 54 48.0 | CV | 18.1 | 19.6 r | r | em | Discovered during Moscow State University's LANAT summer camp. | find.chart | ZTF18aazfitj | ||||
| 15 | Mazepa 1 | USNO-B1.0 1457-0386987 | 22 07 09.64 +55 46 44.8 | UG | 17.7 | 21.0 g | g | find.chart | |||||||
| 16 | Mazepa 2 | 2MASS J08023224+0102426 USNO-B1.0 0910-0158108 | 08 02 32.24 +01 02 42.4 | NL+E | 16.8 | 20.2: g | g | 0.203860 d (4.8926 h) | 18 Nov 2018 (HJD 2458441.078) | FUV-NUV=-0.04 (GALEX DR6). Eclipse on 1954-12-04 POSS-I Blue plate. ZTF18aaabozq | find.chart | ||||
| 17 | Rybka 1 | GSC2.3 N9PR035518 USNO-B1.0 1262-0114189 | 05 49 22.95 +36 13 26.6 | UG | 17.8 | 21.6 r | r | em | Outbursts on 1986-12-29 blue and 1989-11-19 infrared DSS plates. | find.chart | |||||
| 18 | Rybka 2 | GSC2.3 N2YH012776 USNO-B1.0 1304-0479600 | 22 31 37.46 +40 29 43.3 | UGSU+E | 17.6 16.3 | 20.5 21.1 g | g | 0.0819486 d (118.0060 min) | 26 Oct 2021 (HJD 2459513.8834) | min | Outburst on 1989-09-03 DSS red plate. | find.chart | |||
| 19 | Dizepa 1 | GSC2.3 N2UB122577 | 22 24 23.84 +51 30 34.0 | UG | 17.6 | 21.7 r | r | ZTF18abnnidi | |||||||
| 20 | APA-V1 | GSC2.3 N2MT038918 USNO-B1.0 1115-0557399 | 21 20 09.80 +21 31 26.9 | UGSU: | 15.2 | 21.2 r | r | ZTF18abccnddZTF18abccndd | find.chartZTF18abccndd | ||||||
| 21 | Shcheglov 1 | SDSS J010748.50+471159.2 URAT1 686-023415 | 01 07 48.50 +47 11 59.2 | UG | 17.2 g | 21.8 r | g/r | Outburst on 2013 Oct. 02 Pan-STARRS1 images. | find.chart | ||||||
| 22 | Dizepa 2 | GSC2.3 NAGC012765 USNO-B1.0 1700-0009384 | 02 02 00.00 +80 00 48.7 | UG | 17.4 | 20.6 r | r | find.chart | |||||||
| 23 | Taya 2 | GSC2.3 N2Q5048029 USNO-B1.0 1118-0556577 | 21 01 30.22 +21 48 56.3 | UG | 18.3 g | 22.2 B | g/B | Maximum magnitude from ZTF data, minimum magnitude from GSC2.3. | Taya2-PS-ZTF-LC.gif | Taya2-BRIR5x5.jpg | |||||
| 24 | Minkovskiy 1 | GSC2.3 N2PF083436 | 20 36 39.38 +20 17 43.6 | UG | 17.0 R | 22.7 i | R/i | Discovered by 9th-grade student Artur Minkovskiy on DSS images. Outburst on 1992-08-31 POSS-II Red plate. Another outburst on 2011 July 19 - Aug. 06 Pan-STARRS1 images. Maximum magnitude from GSC2.3. Minimum magnitude from Pan-STARRS1. | Minkovskiy1-PS-LC.gif | Minkovskiy1-2-BRIR.jpg | |||||
| 25 | Minkovskiy 2 | GSC2.3 N2PD005009 USNO-B1.0 1103-0549124 ZTF18abktuwb | 20 36 28.42 +20 19 26.6 | UGZ/IW | 16.8 | 19.4 g | g | Discovered by 9th-grade student Artur Minkovskiy on DSS plates 3' WNW of Minkovskiy 1. Type and period in 2017AJ....153..204S are incorrect. Light curve of Minkovskiy 2 from ATLAS data in c and o filters. Light curve of Minkovskiy 2 from ZTF data in g and r filters. ZTF18abktuwb, ZTF18adqqrtm | Minkovskiy2-ATLAS-LC, Minkovskiy2-ZTF-LC | Minkovskiy1-2-BRIR | |||||
| 26 | Minkovskiy 3 | GSC2.3 N24L032316 ZTF18abbxjgd | 18 43 20.52 +29 12 48.9 | UG | 17.9 | 21.7 r | r | Outburst on 1989-05-04 POSS-II Red plate. ZTF18abbxjgd | find.chart | ||||||
| 27 | Minkovskiy 4 | GSC2.3 N2FH192786 USNO-B1.0 1178-0517790 | 19 38 13.32 +27 53 03.8 | EA | 18.8 | 20.4 r | r | 2.00376 d | 07 Aug 2019 (HJD 2458702.798) | Eclipse on 1988-07-14 POSS-II Blue plate | find.chart | ||||
| 28 | Minkovskiy 5 | 2MASS J18335246+0644492 GSC2.3 N1RY045562 USNO-B1.0 0967-0400894 | 18 33 52.48 +06 44 49.3 | EA | 17.4 | 18.8 r | r | 1.68741 d | 02 Jul 2019 (HJD 2458667.166) | find.chart | |||||
| 29 | Minkovskiy 6 | 2MASS J18162799+0319295 GSC2.3 N1MN075300 | 18 16 27.99 +03 19 29.6 | EA/WD | 17.41 | 17.73 r | r | 0.2428935 d (5.82944 h) | 25 Jan 2019 (HJD 2458509.09) | Min II = 17.56r. FUV-NUV = -0.22 (GALEX). | find.chart | ||||
| 30 | Shcheglov 3 | GSC2.3 S90L033946 | 15 26 27.34 -23 01 43.4 | UG | 17.6 B | 22.7 r | B/r | Outburst on 1976-05-21 Blue DSS plate. Maximum magnitude from GSC2.3. Minimum magnitude from Pan-STARRS1 | -- | Shcheglov3-JRIR.jpg | |||||
| 31 | Minkovskiy 7 | GSC2.3 N1MA046631 | 18 18 19.78 +03 58 15.0 | UG | 17.2 | 21.5 r | r | Minkovskiy, ArturOutburst on 1993-05-27 POSS-II Red plate. ZTF18abrxeop | find.chart ZTF18abrxeop | ||||||
| 32 | Minkovskiy 8 | 2MASS J18153954+0534220 GSC2.3 N1M9059733 USNO-B1.0 0955-0346725 | 18 15 39.55 +05 34 22.0 | EA | 16.4 | 18.2 r | r | 1.875252 d | 28 Jan 2019 (HJD 2458511.519) | Eclipse on 1993-05-27 POSS-II Red plate. | find.chart | ||||
| 33 | Minkovskiy 9 | 2MASS J17451072-1850332 GSC2.3 S809006801 USNO-B1.0 0711-0487576 | 17 45 10.72 -18 50 33.2 | M | 13.6 | 17.2 o | o | 381 381 d | 07 Nov 2020 (HJD 2459161) | find.chart | |||||
| 34 | Minkovskiy 10 | GSC2.3 N24J020387 | 18 47 49.12 +25 33 09.2 | UG | 17.8 | 21.4 g | g | ZTF18absaric | minkovskiy10-lc.png | minkovskiy10-brir.jpg | |||||
| 35 | Minkovskiy 11 | 2MASS J19451406+3329280 GSC2.3 N2GT212052 USNO-B1.0 1234-0390122 | 19 45 14.06 +33 29 28.6 | EA | 18.3 | 20.7 g | g | 2.643264 d | 15 May 2019 (HJD 2458619.412) | find.chart | |||||
| 36 | Minkovskiy 12 | GSC2.3 N2GT210710 USNO-B1.0 1234-0391099 | 19 45 29.06 +33 28 15.6 | UG | 15.4 g | 19.8 G | g/G | find.chart | |||||||
| 37 | Minkovskiy 13 | GSC2.3 N2GM152534 | 19 33 27.00 +32 52 49.2 | UG | 18.2 | 22.8: r | r | Outburst on 1988-06-12 POSS-II blue plate. | find.chart | ||||||
| 38 | DAV V1 | Lee 284 2MASS J05475413+5023364 DO 29668 USNO-B1.0 1403-0161780 | 05 47 54.12 +50 23 36.6 | L | 10.4 | 11.4 V | V | C5+,4 | find.chart | ||||||
| 39 | DAV V2 | GSC2.3 N7JO002290 | 11 26 35.53 +49 25 04.3 | UG | 15.1 B | <23 g | B/g | Outburst on 1995-04-24 POSS-II blue plate. | find.chart | ||||||
| 40 | DAV V3 ATO J073.5027+54.5420 | 2MASS J04540067+5432313 USNO-B1.0 1445-0143313 | 04 54 00.67 +54 32 31.3 | SR | 13.0 | 13.4 r | r | 38.7 d | 12 Sep 2020 (HJD 2459105.0) | Light curve from ZTF data in g and r filters. Light curve from ZTF data folded with the best pulsation period | davv3-ztf-lc.png davv3-ztf-phased_lc.png | davv3-brir.jpg | |||
| 41 | Lisniak 1 | 2MASS J18152196+0547464 GSC2.3 N1M2013208 USNO-B1.0 0957-0347391 | 18 15 21.97 +05 47 46.6 | SR | 14.4 | 15.1 r | r | 59.6 d | 23 Jul 2020 (HJD 2459054.0) | J-K= 1.4 (2MASS). | find.chart | ||||
| 42 | Kachalin 3 | 2MASS J18152230+0544236 USNO-B1.0 0957-0347396 | 18 15 22.31 +05 44 23.7 | BY | 16.5 | 16.7 r | r | 6.801 d | 29 Sep 2018 (HJD 2458390.62) | find.chart | |||||
| 43 | Minkovskiy 14 | GSC2.3 N2JL076237 USNO-B1.0 1267-0332999 | 19 13 49.42 +36 44 25.7 | UGSU: | 17.5 | 21.4 r | r | Outburst on 1989-07-01 POSS-II Blue plate. ZTF19aaumqle | find.chart | ||||||
| 44 | KazakevichOA 1 | GSC2.3 N1YT062448 | 20 00 02.87 +10 27 37.2 | UG | 17.3 | <23 r | r | Outburst on 1991-07-17 POSS-II red plate. ZTF19aavhrup | find.chart | ||||||
| 45 | Minkovskiy 15 | 2MASS J18420998+1305215 GSC2.3 N28J098717 USNO-B1.0 1030-0398784 | 18 42 09.98 +13 05 21.7 | EA | 17.42 | 18.2 18.2 r | r | 1.3870743 d | 17 Oct 2019 (HJD 2458773.595) | find.chart | |||||
| 46 | Minkovskiy 16 | 2MASS J19534454+3838432 GSC2.3 N2FQ131991 USNO-B1.0 1286-0369685 | 19 53 44.55 +38 38 43.4 | EA | 17.5 | 18.8 r | r | 5.1837 d | 08 Oct 2019 (HJD 2458764.707) | find.chart | |||||
| 47 | Minkovskiy 17 | USNO-B1.0 1252-0417511 | 20 40 16.47 +35 12 45.6 | EA | 17.1 | 18.7 r | r | 6.2529 d | 15 May 2020 (HJD 2458985.104) | find.chart | |||||
| 48 | Shustov 1 | 2MASS J20524358+4939259 GSC2.3 N30U027050 USNO-B1.0 1396-0373005 | 20 52 43.59 +49 39 26.1 | SR | 16.9 | 17.8 r | r | 79.3 d | 18 Jun 2018 (HJD 2458288.0) | P2=635 d, Epoch2=2458340. | find.chart | ||||
| 49 | KazakevichOA 2 | GSC2.3 N1XM073452 | 19 57 29.77 +10 22 20.2 | UG | 19.2 | 23: r | r | Outburst on 1990-07-27 POSS-II Blue plate. | find.chart | ||||||
| 50 | Minkovskiy 18 | 2MASS J20435282+3208022 GSC2.3 N34O008205 USNO-B1.0 1221-0585747 | 20 43 52.87 +32 08 02.6 | EA | 18.2 | 20.7: g | g | 2.993 d | 15 May 2019 (HJD 2458618.64) | find.chart | |||||
| 51 | Minkovskiy 19 | 2MASS J19435233+1421335 GSC2.3 N1UL022715 USNO-B1.0 1043-0516571 | 19 43 52.35 +14 21 33.6 | EA | 18.1 | 20.3 g | g | 2.087 d | 12 Aug 2018 (HJD 2458343.29) | find.chart | |||||
| 52 | KazakevichOA 3 | GSC2.3 N1WD049517 | 20 01 44.96 +00 46 59.1 | UG | 16.8 16.6 B | 23: g | B/g | Outburst on 1982-08-16 SERC-J plate. | find.chart | ||||||
| 53 | DAV V4 | GSC2.3 S022017033 | 00 06 20.22 -17 38 42.7 | UG | 17.8 B | <23 g | B/g | Outburst on 1977-11-04 DSS blue plate. | find.chart | ||||||
| 54 | KazakevichOA 4 | GSC2.3 S9YD048516 | 19 57 44.32 -01 42 20.7 | UG | 15.5 B | 22.1 g | B/g | Outburst on 1982-08-16 SERC-J plate | find.chart | ||||||
| 55 | Minkovskiy 20 | GSC2.3 N2IX118496 USNO-B1.0 1299-0358589 | 19 50 10.14 +39 57 51.2 | EA | 19.6 | 21.5: g | g | 2.251327 d | 20 Nov 2020 (HJD 2459174.27) | find.chart | |||||
| 56 | Gusev 1 | 2MASS J21383674+4855010 GSC2.3 N2UZ130652 USNO-B1.0 1389-0412934 | 21 38 36.74 +48 55 01.1 | M | 16.3 | 18.4 r | r | 445 d | 10 May 2018 (HJD 2458249) | C: | find.chart | ||||
| 57 | Lisniak 2 | 2MASS J17443645+1316141 GSC2.3 N38Q018052 USNO-B1.0 1032-0307675 | 17 44 36.45 +13 16 13.9 | NL | 17.4 | 17.6 r | r | FUV-NUV=-0.54 (GALEX DR5). M_abs=+5.5 (Gaia EDR3). | find.chart | ||||||
| 58 | Minkovskiy 21 | 2MASS J18421898+1253090 GSC2.3 N28G148621 USNO-B1.0 1028-0439526 | 18 42 18.99 +12 53 09.2 | EA | 17.06 | 19.4: r | r | 3.2214 d | 31 Mar 2020 (HJD 2458939.76) | find.chart | |||||
| 59 | DAV V5 | GSC2.3 S5IO016680 | 10 47 38.47 -17 21 36.9 | UG | 19.4 B | <23 g | B/g | Outburst on 1984-01-30 POSS-II blue plate. | find.chart | ||||||
| 60 | Lisniak 3 | USNO-B1.0 0758-0677744 | 19 36 37.53 -14 08 30.4 | UG | 16.4 16.4 B | 23.7 23.7 g | B/g | Outburst on 1980-07-12 Blue DSS plate. | find.chart | ||||||
| 61 | Gusev 3 | 2MASS J21224796+4935165 GSC2.3 N2TJ075654 USNO-B1.0 1395-0396745 | 21 22 47.96 +49 35 16.5 | M | 15.2 Rc | 19.9 19.9 r | Rc/g | J-K=3.1 (2MASS). | find.chart | ||||||
| 62 | DAV V6 | 2MASS J17120525-2441429 GSC2.3 S8CW005608 USNO-B1.0 0653-0428495 | 17 12 05.25 -24 41 42.8 | SR | 15.2 | 15.7 r | r | 127 d | 09 Apr 2019 (HJD 2458583) | P2=112, Epoch2=2458572 | find.chart | ||||
| 63 | Baraldi 1 | 2MASS J06063044+3455254 GSC2.3 N8B7013479 USNO-B1.0 1249-0121036 | 06 06 30.45 +34 55 25.4 | UV | 17.5 | 20.1 B | B | M4.5 | Flare on 1997-03-10 Blue DSS plate. | find.chart | |||||
| 64 | BhaNaViRa 1 | PSO J194629.686+115207.601 ZTF18acwrtad | 19 46 29.68 +11 52 07.4 | UG | 17.8 | 23: r | r | Outburst on 1990-08-13 POSS-II Blue plate | find.chart | ||||||
| 65 | DAV V7 | 2MASS J19570232+3034423 GSC2.3 N32G191666 | 19 57 02.33 +30 34 42.4 | M | 14.8 | <18.0 i | i | 328 d | 15 Aug 2020 (HJD 2459077) | find.chart | |||||
| 66 | Minkovskiy 22 | GSC2.3 SA5J062679 | 19 30 13.33 -08 07 53.7 | NL+E: | 19.3 | 21.7 r | r | find.chart | |||||||
| 67 | BhaNaViRa 2 | 2MASS J20363987+3539141 USNO-B1.0 1256-0417004 | 20 36 39.87 +35 39 14.0 | SR | 15.8 | 17.2 r | r | 912 d | 07 Jun 2022 (HJD 2459738) | Elements in the table are for the minima of the Long Secondary Period (LSP). Also pulsations with P= 112 d. | find.chart | ||||
| 68 | DAV V8 | 2MASS J18485565+0305063 GSC2.3 N1NT030045 | 18 48 55.66 +03 05 06.3 | M | 15.7 | <18.5 i | i | 346 OGLE? 361.6 d | 16 Sep 2018 (HJD 2458378.0) | find.chart | |||||
| 69 | DAV V9 | 2MASS J18290234-0825394 GSC2.3 S9OF074518 | 18 29 02.35 -08 25 39.5 | M | 16.1 | <18.9 i | i | 358 359.5 d | 25 Aug 2020 (HJD 2459087.0) | find.chart | |||||
| 70 | DAV V10 | 2MASS J18493478+0323473 GSC2.3 N1NV035122 | 18 49 34.79 +03 23 47.2 | M | >16.1 | 18.5 i | i | find.chart | |||||||
| 71 | Minkovskiy 23 | 2MASS J19431861+3310081 GSC2.3 N2GV043397 USNO-B1.0 1231-0433523 | 19 43 18.63 +33 10 08.0 | EA | 17.52 | 19.9 g | g | 2.7129 d | 11 Aug 2018 (HJD 2458342.4) | find.chart | |||||
| 72 | Lisniak 4 | GSC2.3 S9NX025553 | 18 14 29.38 -08 38 15.0 | UG | 16.7 B | 23: g | B/g | find.chart | |||||||
| 73 | DAV V11 | 2MASS J18505837+0153276 GSC2.3 N1NZ028223 | 18 50 58.38 +01 53 27.6 | M | 17.5: | 20.7: i | i | 07 Oct 2020 (HJD 2459130): | find.chart | ||||||
| 74 | BhaNaViRa 3 | 2MASS J10155540-0540052 GSC2.3 S52U003612 USNO-B1.0 0843-0209006 | 10 15 55.40 -05 40 05.1 | UV | 17.6 R | 20.2 G | R/G | Flare on 1986-03-31 POSS-II Red plate. | find.chart | ||||||
| 75 | Gusev 4 | 2MASS J21224020+4935392 GSC2.3 N2TJ035177 USNO-B1.0 1395-0396648 | 21 22 40.21 +49 35 39.2 | EA | 17.3 | <21.0 r | r | 2.0475 d | 15 Oct 2019 (HJD 2458772.32) | find.chart | |||||
| 76 | BhaNaViRa 5 | GSC2.3 N347071005 USNO-B1.0 1255-0420410 | 20 37 46.47 +35 30 12.3 | UG|YSO: | 19.3 B | 22.3 g | B/g | Brighter on 1989-06-30 POSS-II blue plate. | find.chart | ||||||
| 77 | Arinkin 1 | 2MASS J03032084+6029284 USNO-B1.0 1504-0102509 | 03 03 20.83 +60 29 28.4 | YSO | 16.9 | 17.4 r | r | B7.0 | find.chart | ||||||
| 78 | DAV V12 | Gaia DR3 4095182738993295104 | 18 02 59.78 -19 58 45.5 | L | 17.6 | 18.4 i | i | Uncertain identiification. 0.8" pair of red stars. The NW component, brighter (G= 19.2) in Gaia DR3, has been chosen as the variable. The other star is 2MASS J18025980-1958459 (G= 19.5). Combined range given. | find.chart | ||||||
| 79 | BhaNaViRa 6 | GSC2.3 NAPK018208 | 05 56 14.92 +50 31 55.0 | SN|UG | 18.1 R | <23 r | R/r | Outburst on 1989-12-04 POSS-II Red plate. 24'' NE from the center of the galaxy 2MASX J05561281+5031408. | find.chart | ||||||
| 80 | DAV V13 | 2MASS J18281545-1318372 GSC2.3 S9JW101828 | 18 28 15.45 -13 18 37.2 | L | 17.4 | 17.6 i | i | find.chart | |||||||
| 81 | BhaNaViRa 4 | GSC2.3 N3QT005599 | 16 01 30.44 +08 01 09.0 | UG: | 17.9 R | <24 r | R/r | Outburst on 1989-04-08 POSS-II Red plate. | find.chart | ||||||
| 82 | BhaNaViRa 7 | Gaia DR3 2025469403899718016 | 19 36 22.41 +28 15 29.0 | UG | 17.2 CR | 20.4 r | CR/r | find.chart | |||||||
| 83 | DAV V14 | 2MASS J19120236+0834324 GSC2.3 N2BI137237 | 19 12 02.36 +08 34 32.4 | L | 18.6 | 19.6: i | i | find.chart | |||||||
| 84 | Vizgin 1 | 2MASS J18245594-1014389 | 18 24 55.94 -10 14 39.0 | YSO: | 18.7 | 20.1: i | i | find.chart | |||||||
| 85 | BhaNaViRa 8 Gaia DR3 2056607023408105216 | 2MASS J20351475+3513598 GSC2.3 N346015798 USNO-B1.0 1252-0411211 | 20 35 14.76 +35 13 59.7 | SRB | 14.0 | 14.7 r | r | 68 d | 20 Jun 2019 (HJD 2458655) | Other period 82 days. | find.chart | ||||
| 86 | BhaNaViRa 9 | Gaia DR3 2045447083480954368 | 19 38 32.77 +32 58 11.0 | UG | 17.4 B | 21.6 g | B/g | find.chart | |||||||
| 87 | BhaNaViRa 10 | 2MASS J06343849+0413088 GSC2.3 N833014001 | 06 34 38.49 +04 13 08.9 | YSO | 19.4 | 20.7 r | r | find.chart | |||||||
| 88 | DAV V15 | 2MASS J17573051-1847430 USNO-B1.0 0712-0518730 | 17 57 30.52 -18 47 43.1 | L | 18.0 | 19.9 i | i | find.chart | |||||||
| 89 | BhaNaViRa 11 | 2MASS J18123068-1746159 GSC2.3 S9J9039713 | 18 12 30.68 -17 46 15.8 | L | 16.8 | 17.0 i | i | M | find.chart | ||||||
| 90 | BhaNaViRa 12 | GSC2.3 S9M8097647 | 18 51 14.76 -05 09 24.0 | UG: | 17.0 B | 23.8 r | B/r | find.chart | |||||||
| 91 | Vizgin 2 | 2MASS J19443022+2334510 | 19 44 30.21 +23 34 50.8 | YSO | 19.6 | 21.3 r | r | find.chart | |||||||
| 92 | BhaNaViRa 14 | 2MASS J18055611-2135008 | 18 05 56.12 -21 35 00.8 | YSO | 18.6 | 19.8 i | i | BhaNaViRa14-ZTF-LC.gif | -- | ||||||
| 93 | Vizgin 3 | 2MASS J18281469-0341187 GSC2.3 S9IJ024629 | 18 28 14.70 -03 41 18.6 | L | 18.5 | 18.7 i | i | find.chart | |||||||
| 94 | BhaNaViRa 15 | 2MASS J18275006-1315554 | 18 27 50.06 -13 15 55.3 | YSO | 17.5 | 18.6 i | i | find.chart | |||||||
| 95 | BhaNaViRa 16 | GSC2.3 N5Z4013338 USNO-B1.0 1443-0239042 | 15 03 04.78 +54 22 30.2 | UV+BY | 16.6 | 17.6 g | g | M4V | ZTF18aaqmvjx | find.chart | |||||
| 96 | BhaNaViRa 17 | GSC2.3 N2FJ086391 | 19 40 08.77 +28 58 03.9 | UG: | 17.4 R | <23 r | R/r | find.chart | |||||||
| 97 | ShatalovaJ 1 | 2MASS J15552271+2645028 GSC2.3 N64V003636 USNO-B1.0 1167-0266312 | 15 55 22.64 +26 45 02.7 | UV | 19.3 B | 21.9 g | B/g | M5.0V | Flare on 1990-05-17 Blue DSS plate. | find.chart | |||||
| 98 | Lisniak 5 | GSC2.3 N5CO011100 | 13 16 11.48 +23 17 17.4 | UG | 17.5 B | <23 g | B/g | find.chart | |||||||
| 99 | BhaNaViRa 13 | GSC2.3 SA5J054623 | 19 30 54.39 -08 24 23.4 | VAR | 18.1 B | 24.3 g | B/g | Outburst on 1983-07-14 DSS blue plate. // Подаем в ПЗП однозначно! Uncertain identification. Object looks too red for a dwarf nova and is 1" to the WSW of the GSC2.3 position. | find.chart | ||||||
| 100 | BhaNaViRa 18 | 2MASS J14201486+5722219 GSC2.3 N48Q003240 USNO-B1.0 1473-0291502 | 14 20 14.87 +57 22 21.9 | UV | 15.8 | 18.6 g | g | M4V | find.chart | ||||||
| 101 | BhaNaViRa 19 | GSC2.2 N023330362558 | 19 10 14.68 +17 05 15.3 | UG: | 18.9 B | 22: g | B/g | The object's magnitude in GSC2.2 is the same as the GSC2.3 magnitude (18.86) for GSC2.3 N2CZ062558, which is 1.0" to the E. PS1 | find.chart | ||||||
| 102 | DAV V16 | GSC2.3 S04L006770 | 00 57 58.42 -06 23 24.2 | SN: | 18.5 B | <24.5: r | B/r | Outburst on 1982-11-19 DSS blue plate. DES J005758.40-062323.8, classified as a galaxy, is 0.4" away from the GSC2.3 position. | find.chart | ||||||
| 103 | BhaNaViRa 20 | GSC2.2 S222232093763 | 16 37 29.31 -28 41 41.6 | UG: | 18.4 B | <23 g | B/g | find.chart | |||||||
| 104 | BhaNaViRa 21 | 2MASS J18274991-1315522 GSC2.3 S9JW102186 USNO-B1.0 0767-0506859 | 18 27 49.91 -13 15 52.2 | YSO | 18.0 | 19.0 r | r | find.chart | |||||||
| 105 | BhaNaViRa 22 | 2MASS J18041531-2101328 GSC2.3 S9J7045923 | 18 04 15.31 -21 01 32.9 | SR | 15.8 | 16.0 i | i | 41 d | 28 May 2020 (HJD 2458998) | find.chart | |||||
| 106 | DAV V17 | GSC2.3 SBLR009288 | 22 44 47.48 -28 07 22.2 | UG: | 16.2 B | <23 g | B/g | Outburst on 1980-09-30 DSS blue plate. | find.chart | ||||||
| 107 | DAV V18 | GSC2.3 S34J013410 | 02 59 10.89 -27 32 35.5 | SN: | 18.4 B | <23 g | B/g | Outburst on 1977-12-12 DSS blue plate. | find.chart | ||||||
| 108 | BhaNaViRa 25 | 2MASS J18074942-2155576 GSC2.3 SA6B009713 USNO-B1.0 0680-0649365 | 18 07 49.43 -21 55 57.7 | SR | 15.8 | 16.1 r | r | 32.6 d | 03 Aug 2019 (HJD 2458698.6) | find.chart | |||||
| 109 | BhaNaViRa 23 | 2MASS J18032071-2052521 GSC2.3 S9J7010983 USNO-B1.0 0691-0572722 | 18 03 20.72 -20 52 52.3 | L | 16.88 | 16.97 r | r | find.chart | |||||||
| 110 | BhaNaViRa 24 | 2MASS J18034395-2036518 GSC2.3 S9J7046833 | 18 03 43.96 -20 36 51.9 | L | 15.6 | 15.9 i | i | find.chart | |||||||
| 111 | BhaNaViRa 26 | 2MASS J18024763-2015037 GSC2.3 S9J6044797 | 18 02 47.64 -20 15 03.7 | L | 15.0 | 15.2 i | i | find.chart | |||||||
| 112 | BhaNaViRa 27 | 2MASS J18031038-2051508 GSC2.3 S9J7046306 USNO-B1.0 0691-0572377 | 18 03 10.38 -20 51 51.1 | L | 16.55 | 16.71 i | i | ||||||||
| 113 | BhaNaViRa 28 | 2MASS J18274029-0327053 GSC2.3 S9IJ024723 | 18 27 40.30 -03 27 05.5 | L | 17.20 | 17.46 i | i | ||||||||
| 114 | Brodskaya 1 | PSO J114739.493+612535.053 | 11 47 39.49 +61 25 35.0 | UV | 18.7 | 24.3: r | r | Flare on PanSTARRS-1 red image on 2012 Mar. 28. | |||||||
| 1 | DDE 203 | 2MASS J19442324+0603253 USNO-B1.0 0960-0481213 | 19 44 23.26 +06 03 25.3 | EA | 16.76 | 20.2 g | g | 1.662489 d | 25 Jun 2019 (HJD 2458660.246) | Eclipses on 1993-06-16 POSS-II Red plate and on 1982-06-24 Quick-V plate. Light curve from ZTF data folded with the best orbital period | DDE203-ZTF-phased_LC.gif | DDE203-BRIR5x5.jpg | |||
| 2 | DDE 204ZTF18abuclqi | GSC2.3 N1XW034389 | 20 16 48.60 +06 01 36.7 | UG | 17.9 | 21.8 g | g | Outburst on 1988-07-08 POSS-II Blue plate. Light curve from ZTF data in r filter | DDE204-ZTF-LC.gif | DDE204-BRIR5x5.jpg | |||||
| 3 | DDE 205 | 2MASS J19255660+0609479 USNO-B1.0 0961-0438941 | 19 25 56.61 +06 09 47.9 | EA | 16.7 r! (17.4) | 20.3: g | g | 2.470008 d | 30 Mar 2018 (HJD 2458208.048) | Eclipse on 1992-08-01 POSS-II Red plate. | find.chart | ||||
| 4 | DDE 206 | USNO-B1.0 0733-0096113 | 06 11 39.28 -16 37 47.3 | EA/HW | 18.2 | <20.0 g | g | 0.1124801 d (2.69952 h) | 13 Jan 2020 (HJD 2458861.892) | Reflection effect amplitude 0.25 mag. | find.chart | ||||
| 5 | DDE 207 | 2MASS J19193618+0643468 USNO-B1.0 0967-0453894 | 19 19 36.19 +06 43 46.8 | EA | 17.2 | 18.9 g | g | 3.82714 d | 20 Nov 2020 (HJD 2459173.649) | Eclipse on 1992-08-01 POSS-II Red plate. | find.chart | ||||
| 6 | DDE 208 ATO J108.2755-08.7561 | 2MASS J07130613-0845218 USNO-B1.0 0812-0129928 | 07 13 06.13 -08 45 22.0 | CV AM | 16.215.8 | 18.419.2 r | r | 0.0829019 d (119.3787 min) | 01 Nov 2017 (HJD 2458059.029) | Minimum epoch is given. Maxima at phases 0.25 and 0.83, Min II = 17.8 g at phase 0.37. Shape of the light curve is varying. | find.chart | ||||
| 7 | DDE 209 | 2MASS J20573222-1804567 USNO-B1.0 0719-1057253 | 20 57 32.22 -18 04 56.9 | CV NL | 14.3 | 14.5 r | r | FUV-NUV=-0.47 (GALEX). M_abs=+5.5 (Gaia EDR3). | find.chart | ||||||
| 8 | DDE 210 | GSC2.3 N2QK043588 | 20 48 33.58 +14 42 06.0 | UG | 15.9 R | 22.8 r | R/r | Outbursts on 1990-08-17 POSS-II Red and 1993-07-13 IR plates. | find.chart | ||||||
| 9 | DDE 211 | GSC2.3 N38M019705 USNO-B1.0 1046-0314806 | 17 57 24.21 +14 40 16.5 | UG | 17.5 | 20.5 g | g | Outburst on 1992-06-28 POSS-II Blue plate. | find.chart | ||||||
| 10 | DDE 212 | USNO-B1.0 1090-0273107 | 17 25 22.21 +19 00 49.1 | HADS | 18.4 | 18.8 c | c | 0.0563777 d (81.1839 min) | 22 May 2020 (HJD 2458992.151) | find.chart | |||||
| 11 | DDE 213 | GSC2.3 N2DB119281 | 19 07 08.08 +15 40 33.0 | UG | 18.2 | 20.1 21.1 g | g | Outburst on 1990-06-22 POSS-II Blue plate. | find.chart | ||||||
| 12 | DDE 214 | GSC2.3 N2OU071459 | 20 29 32.88 +15 46 31.6 | UG | 18.2 | 23.5: r | r | Outburst on 1990-06-22 POSS-II Blue plate. | find.chart | ||||||
| 13 | DDE 215 | 2MASS J18350035+1427311 USNO-B1.0 1044-0360583 | 18 35 00.36 +14 27 31.2 | EA | 17.0 | 18.7 g | g | 1.324065 d | 13 Nov 2020 (HJD 2459167.119) | Eclipses on 1990-06-21 and 1990-06-25 POSS-II Blue plates. | find.chart |
Original tables and data by Denis Denisenko (d.v.denisenko@gmail.com)
Установка зависимостей: numpy matplotlib pandas astropy requests или pip install -r requirements.txt